Get Certified for
Capital Markets (CMSA®)
From equities and fixed income to derivatives, the CMSA certification bridges the gap from where you are now to where you want to be — a world-class capital markets analyst.
Technical analysis tools for recognizing emerging bullish or bearish market patterns
Triangle patterns are a commonly used technical analysis tool. It is important for every trader to recognize patterns as they form in the market. Patterns are vital to a trader’s quest to spot trends and predict future outcomes, enabling them to trade more successfully and profitably. Triangle patterns are important because they help indicate the continuation of a bullish or bearish market. They can also assist a trader in spotting a market reversal.
There are three types of triangle patterns: ascending, descending, and symmetrical. The picture below depicts all three. As you read the breakdown for each pattern, you can use this picture as a point of reference, a helpful visualization tool you can use to get a mental picture of what each pattern might look like. And here is the short version of triangle patterns:
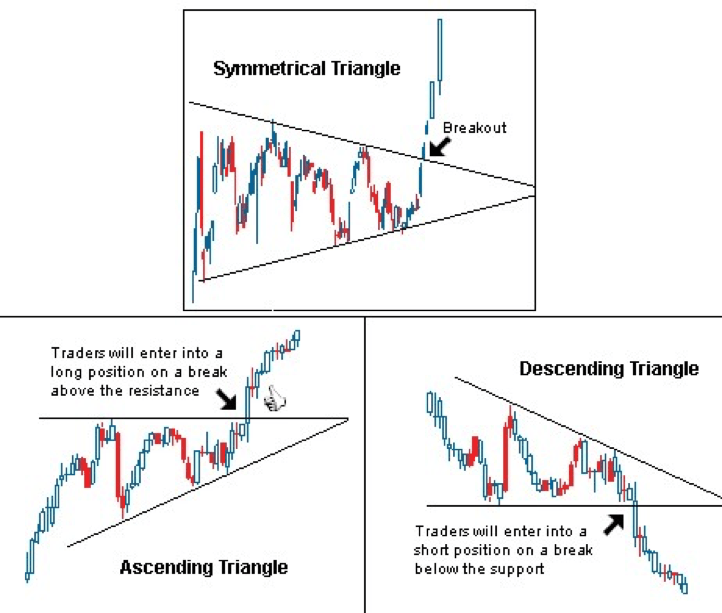
Ascending triangle patterns are bullish, meaning that they indicate that a security’s price is likely to climb higher as the pattern completes itself. This pattern is created with two trendlines.
The first trendline is flat along the top of the triangle and acts as a resistance point, which—after the price successfully breaks above it—signals the resumption or beginning of an uptrend. The second trendline—the bottom line of the triangle that shows price support—is a line of ascension formed by a series of higher lows. It is this configuration formed by higher lows that forms the triangle and gives it a bullish characterization. The basic interpretation is that the pattern reveals that each time sellers attempt to push prices lower, they are increasingly less successful.
The ascending triangle pattern forms as a security’s price bounces back and forth between the two lines. Prices move to a high, which inevitably meets resistance that leads to a drop in price as securities are sold. Although the price may fail to overcome the resistance several times, this does not lead to increased power for sellers, as evidenced by the fact that each sell-off after meeting resistance stops at a higher level than the previous sell-off attempt.
Eventually, the price breaks through the upside resistance and continues in an uptrend. In many cases, the price is already in an overall uptrend, and the ascending triangle pattern is viewed as a consolidation and continuation pattern. In the event that an ascending triangle pattern forms during an overall downtrend in the market, it is typically seen as a possible indication of an impending market reversal to the upside.
Because the ascending triangle is a bullish pattern, it’s important to pay close attention to the supporting ascension line because it indicates that bears are gradually exiting the market. Bulls (or buyers) are then capable of pushing security prices past the resistance level indicated by the flat top line of the triangle.
As a trader, it’s wise to be cautious about making trade entries before prices break above the resistance line because the pattern may fail to form fully or be violated by a move to the downside. There is less risk involved by waiting for the confirming breakout. Buyers can then reasonably place stop-loss orders below the low of the triangle pattern.
Based on its name, it should come as no surprise that a descending triangle pattern is the exact opposite of the pattern we’ve just discussed. This triangle pattern offers traders a bearish signal, indicating that the price will continue to lower as the pattern completes itself. Again, two trendlines form the pattern, but in this case, the supporting bottom line is flat, while the top resistance line slopes downward.
Just as an ascending triangle is often a continuation pattern that forms in an overall uptrend, likewise, a descending triangle is a common continuation pattern that forms in a downtrend. If it appears during a long-term uptrend, it is usually taken as a signal of a possible market reversal and trend change. The pattern develops when a security’s price falls but then bounces off the support line and rises.
However, each attempt to push prices higher is less successful than the one before, and eventually, sellers take control of the market and push prices below the supporting bottom line of the triangle. This action confirms the descending triangle pattern’s indication that prices are headed lower. Traders can sell short at the time of the downside breakout, with a stop-loss order placed a bit above the highest price reached during the formation of the triangle.
Traders and market analysts commonly view symmetrical triangles as consolidation patterns that may forecast either the continuation of the existing trend or a trend reversal. This triangle pattern is formed as gradually ascending support lines and descending resistance lines meet up as a security’s trading range becomes increasingly smaller. Typically, a security’s price will bounce back and forth between the two trendlines, moving toward the apex of the triangle, eventually breaking out in one direction or the other and forming a sustained trend.
If a symmetrical triangle follows a bullish trend, watch carefully for a breakout below the ascending support line, which would indicate a market reversal to a downtrend. Conversely, a symmetrical triangle following a sustained bearish trend should be monitored for an upside breakout indication of a bullish market reversal.
Regardless of whether a symmetrical triangle breakout goes in the direction of continuing the existing trend or in the direction of a trend reversal, the momentum that is generated when the price breaks out of the triangle is usually sufficient to propel the market price a significant distance. Thus, the breakout from a symmetrical triangle is usually considered a strong signal of future trend direction, which traders can follow with some confidence. Again, the triangle formation offers easy identification of reasonable stop-loss order levels—below the low of the triangle when buying or above the triangle high if selling short.
In the end, as with any technical indicator, successfully using triangle patterns really comes down to patience and due diligence. While these three triangle patterns tend toward certain signals and indications, it’s important to stay vigilant and remember that the market is not known for being predictable and can change directions quickly. This is why judicious traders eyeing what looks like a triangle pattern shaping up will wait for the breakout confirmation by price action before adopting a new position in the market.
Connect what you just learned to a clear career path with CFI’s role‑based courses and certification programs.
Thank you for reading CFI’s guide on Triangle Patterns – Technical Analysis. To keep advancing your career, the additional CFI resources below will be useful:


