Get Certified for
Business Intelligence (BIDA®)
Develop analytical superpowers by learning how to use programming and data analytics tools such as VBA, Python, Tableau, Power BI, Power Query, and more.
Cross-sectional data analysis is the analysis of datasets at a fixed point in time
Cross-sectional data analysis is when you analyze a data set at a fixed point in time. Surveys and government records are some common sources of cross-sectional data. The datasets record observations of multiple variables at a particular point in time.

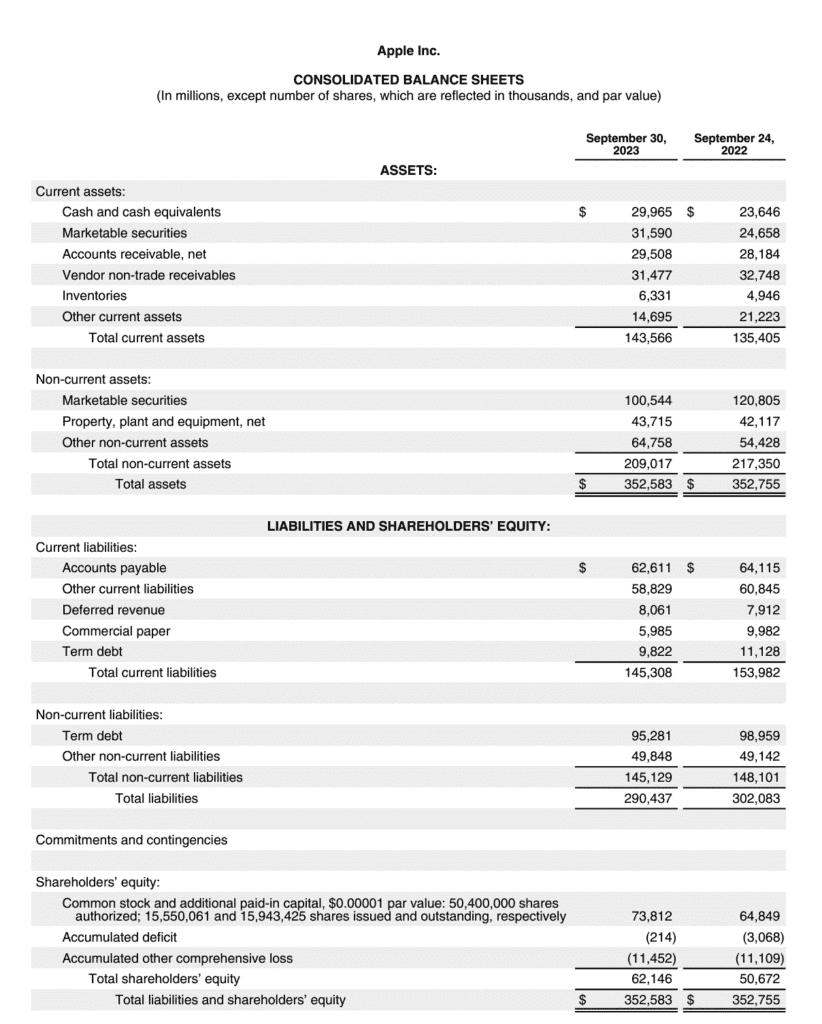
Financial analysts may, for example, want to compare the financial position of two companies at a specific point in time. To do so, they might compare the two companies’ balance sheets.
Below are Amazon’s and Apple’s End of Year Consolidated Balance Sheets. An analyst could use them to look at each company’s 2023 financial position. However, the slight difference in reporting-period ending dates could necessitate making a few adjustments.

 CFI’s Advanced Financial Modeling & Valuation Course includes an extensive case study on Amazon.
Cross-sectional datasets examples include:
Cross-sectional datasets are used extensively in economics and other social sciences. Applied microeconomics uses cross-sectional datasets to analyze labor markets, public finance, industrial organization theory, and health economics. Political scientists use cross-sectional data to analyze demography and electoral campaigns.
Financial analysts will typically compare the financial statements of two companies; a cross-sectional analysis would be to compare the statements of two companies at the same point in time. Contrast that to time-series data analysis, which would compare the financial statements of the same company across multiple time periods.
Random sampling is a statistical framework that is widely used in data analysis. The random sampling method works under the assumption that there exists a close link between the population and a sample taken from that population.
Consider the example of orange consumption by Ghanaian households described above. It would take a lot of resources (both time and money) to measure the actual orange consumption of every household in Ghana. It would be much cheaper to only measure the orange consumption of 1,000 households in Ghana. In such a case, the population consists of every household in Ghana, and the sample consists of 1,000 households whose orange consumption data is known.
Econometric analysis of cross-sectional data sets usually assumes that the data is independently generated and that the observations are mutually independent. Such an assumption of independently generated data is violated when the economic unit of analysis is large, relative to the population.
Suppose we want to analyze the GDP of all countries in North America. Our population, in this case, consists of 23 countries. Any sample we construct from the population can’t possibly support the construction of a mutually independent random sample. For example, it is extremely likely that the GDP of the United States is correlated with the GDP of Canada.
Consider a cross-sectional dataset that measures K characteristics for N different economic entities at time t. An individual observation in the cross-sectional dataset is of the form:
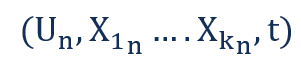
Where:
The cross-sectional dataset was created using a random sample drawn from the population (F, X, t), where F is the joint distribution of all (U,X) in the population at time t.
Cross-sectional data analysis involves examining data sets at a fixed point in time, providing valuable insights into various phenomena. This article delves into the concept, examples, uses, sources, and methodology of cross-sectional data analysis. Additionally, it explores the importance of random sampling in ensuring accurate and representative analysis.
Thank you for reading CFI’s guide to Cross-Sectional Data Analysis. To keep learning and advancing your career, the following CFI resources will be helpful:
Here are a few responses to the commonly asked questions on cross-sectional data analysis:
Cross-sectional data involves analyzing a dataset at a specific point in time, capturing multiple variables simultaneously. For instance, examining the GDP of different countries in a single year or comparing the financial statements of companies at a fixed date are examples of cross-sectional data analysis.
An example of a cross-sectional study could be analyzing the income levels of individuals across various age groups in a particular country at a specific time. This study captures a snapshot of income distribution across different demographics without following them over time.
A cross-sectional study falls under observational research, where data is collected at a single point in time without any follow-up. It provides insights into the characteristics or variables of a population at a specific moment, allowing researchers to analyze relationships between variables without considering causality over time.


