Exponential Growth

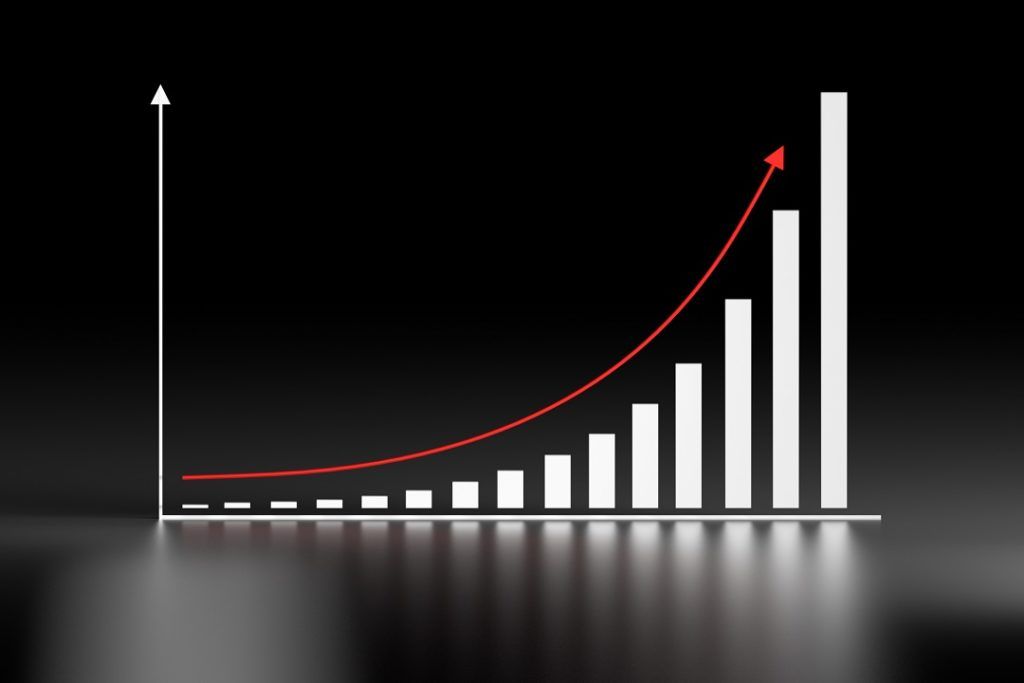
A graph that is flat in the beginning and instantaneously grows in the vertical direction over a period of time

Over 2 million + professionals use CFI to learn accounting, financial analysis, modeling and more. Unlock the essentials of corporate finance with our free resources and get an exclusive sneak peek at the first module of each course. Start Free

What is Exponential Growth?

Exponential growth is when data rises over a period of time, creating an upwards trending curve on a graph. In mathematics, when the function includes a power (or an exponent), the calculation would be increasing exponentially. For example, if hens lay eggs three times per year and triples every year, then in the second year, there would be 27, and in the third year, there would be 81.

Exponential Growth - Image of a chart with an upward-pointing arrow

Summary

  • Exponential growth can be illustrated as a graph that is flat in the beginning and instantaneously grows in the vertical direction over a period of time.
  • Within the realm of finance, exponential growth is mostly seen in compounding interest, which is prevalent in various investment instruments, including stocks and high-interest savings accounts.
  • Compound interest is favorable to investors, as they can increase their net worth over time using a small amount of cash flow.

Understanding Exponential Growth

Within the realm of finance, when an individual saves money in a high-yield savings account for an extensive period of time, the investor will receive compound returns due to exponential growth. It is an example of how investments can grow exponentially with little initial outlay.

If the account provides a compound interest rate, then the investor will receive interest on the principal and interest payment received from the previous period. For example, in the first year, the investor may receive 15% interest on a $100 face value bond that matures in 30 years. Therefore, he would receive $15.

In the second year, the 15% interest rate would then be applied to $115 rather than $100, considering the interest payment given in year one. Thus, as each year passes by, interest payments will continue to accumulate and be considered within the yearly interest payment calculation by the time the financial instrument matures. If illustrated, the growth would be an exponential curve.

Exponential Growth Formula

Illustratively, an exponential graph will begin low and appear flat for some time before increasing almost in the vertical direction. It can be perceived as follows:

V = S * (1+r)^T

Where:

  • S = Beginning value or principal amount
  • r = Rate of return (or interest rate)
  • T = Time that’s passed since the issuance of the financial instrument

Understanding What Compounding Is

To investors, compounding means the ability to grow one’s wealth exponentially over a period of time by earning interest on the additional earnings received from previous interest payments that stem from the principal amount. It contrasts with simple interest, as it does not reflect compounding. Simple interest only pays interest on the original principal, not including the earnings received over the lifetime of the financial instrument.

To calculate compound interest, the formula is as follows:

P[(1+i)^n-1]

Where:

  • P = Principal
  • i = Nominal annual interest rate
  • N = Number of compounding periods

Uses of Exponential Growth

Exponential growth is often used in financial modeling. Although the concept is apparent in a high-interest savings account, the reason is that interest rates tend to not waver or fluctuate as much during different economic states. However, when considering stocks, returns are not as smooth.

Overall, exponential growth models are useful in predicting investment returns when the growth rate is steady and does not oscillate frequently.

More Resources

Thank you for reading CFI’s guide to Exponential Growth. To keep learning and advancing your career, the following resources will be helpful:

0 search results for ‘