Skewness

A measure of the deviation of a random variable’s given distribution from the normal distribution

Over 1.8 million professionals use CFI to learn accounting, financial analysis, modeling and more. Start with a free account to explore 20+ always-free courses and hundreds of finance templates and cheat sheets.

What is Skewness?

Skewness is a measure of asymmetry or distortion of symmetric distribution. It measures the deviation of the given distribution of a random variable from a symmetric distribution, such as normal distribution. A normal distribution is without any skewness, as it is symmetrical on both sides. Hence, a curve is regarded as skewed if it is shifted towards the right or the left.

Skewness - Chart

Summary

  • Skewness measures the deviation of a random variable’s given distribution from the normal distribution, which is symmetrical on both sides.
  • A given distribution can be either be skewed to the left or the right. Skewness risk occurs when a symmetric distribution is applied to the skewed data.
  • Investors take note of skewness while assessing investments’ return distribution since extreme data points are also considered.

Types of Skewness

1. Positive Skewness

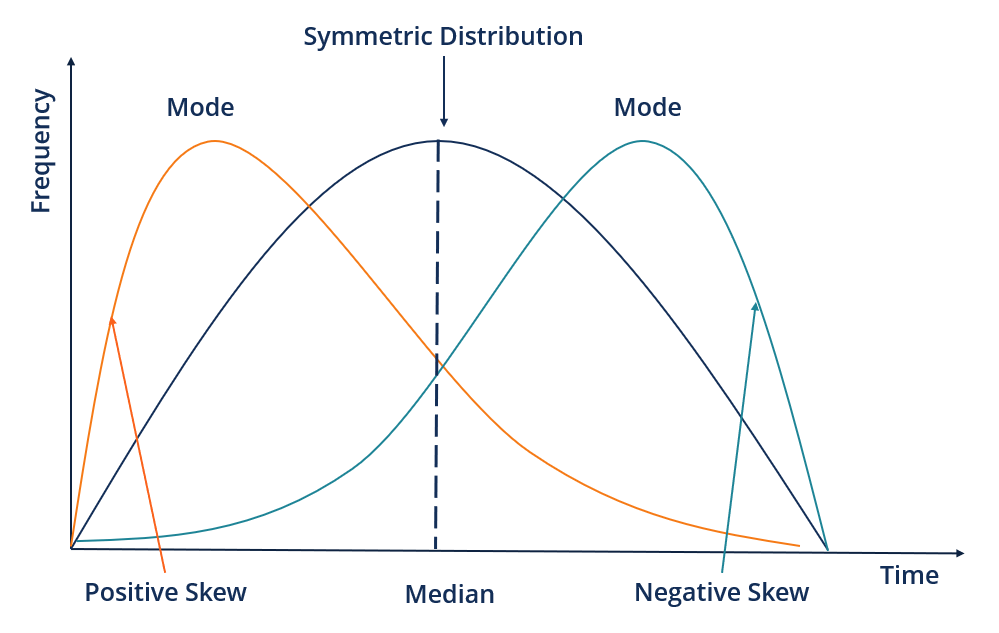
If the given distribution is shifted to the left and with its tail on the right side, it is a positively skewed distribution. It is also called the right-skewed distribution. A tail is referred to as the tapering of the curve differently from the data points on the other side.

As the name suggests, a positively skewed distribution assumes a skewness value of more than zero. Since the skewness of the given distribution is on the right, the mean value is greater than the median and moves towards the right, and the mode occurs at the highest frequency of the distribution.

2. Negative Skewness

If the given distribution is shifted to the right and with its tail on the left side, it is a negatively skewed distribution. It is also called a left-skewed distribution. The skewness value of any distribution showing a negative skew is always less than zero. The skewness of the given distribution is on the left; hence, the mean value is less than the median and moves towards the left, and the mode occurs at the highest frequency of the distribution.

Measuring Skewness

Skewness can be measured using several methods; however, Pearson mode skewness and Pearson median skewness are the two frequently used methods. The Pearson mode skewness is used when a strong mode is exhibited by the sample data. If the data includes multiple modes or a weak mode, Pearson’s median skewness is used.

The formula for Pearson mode skewness:
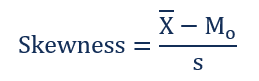
Pearson mode skewness

Where:

  • X = Mean value
  • Mo = Mode value
  • s = Standard deviation of the sample data

The formula for Person median skewness:
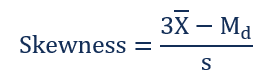
Person Median Skewness - Formula

Where:

  • Md = Median value

How to Interpret

  • Skewness also includes the extremes of the dataset instead of focusing only on the average. Hence, investors take note of skewness while estimating the distribution of returns on investments. The average of the data set works out if an investor holds a position for the long term. Therefore, extremes need to be looked at when investors seek short-term and medium-term security positions.
  • Usually, a standard deviation is used by investors in forecasting returns, and it presumes a normal distribution with zero skewness. However, because of skewness risk, it is better to obtain the performance estimations based on skewness. Moreover, the occurrence of return distributions coming close to normal is low.
  • Skewness risk occurs when a symmetric distribution is applied to the skewed data. The financial models seeking to estimate an asset’s future performance consider a normal distribution. However, skewed data will increase the accuracy of the financial model.
  • If a return distribution shows a positive skew, investors can expect recurrent small losses and few large returns from investment. Conversely, a negatively skewed distribution implies many small wins and a few large losses on the investment.
  • Hence, a positively skewed investment return distribution should be preferred over a negatively skewed return distribution since the huge gains may cover the frequent – but small – losses. However, investors may prefer investments with a negatively skewed return distribution. It may be because they prefer frequent small wins and a few huge losses over frequent small losses and a few large gains.

Additional Resources

Thank you for reading CFI’s guide to Skewness. To keep advancing your career, the additional CFI resources below will be useful:

0 search results for ‘