Get Certified for
Business Intelligence (BIDA®)
Develop analytical superpowers by learning how to use programming and data analytics tools such as VBA, Python, Tableau, Power BI, Power Query, and more.
A popular programming language widely used for data science and data analysis
R is a popular programming language that is widely used for data science and data analysis. R is an open-source language, so it is free to use and can be extended with additional functionality. It was originally developed for statistical computing and generating graphics.
R comes from the world of academia — it is used to create reproducible research with statistics and graphics. However, R is now widely used in numerous industries, such as health care and data science. This in-demand skill is a smart pickup for anyone who wants to grow their career in the finance industry.
As an open-source language, R is extensible. Its base capability is known as Base R, but R possesses many different packages that extend this functionality. This includes a wide variety of statistical functionality, such as linear modeling, classification, clustering, statistical tests, time-series analysis, and graphing.
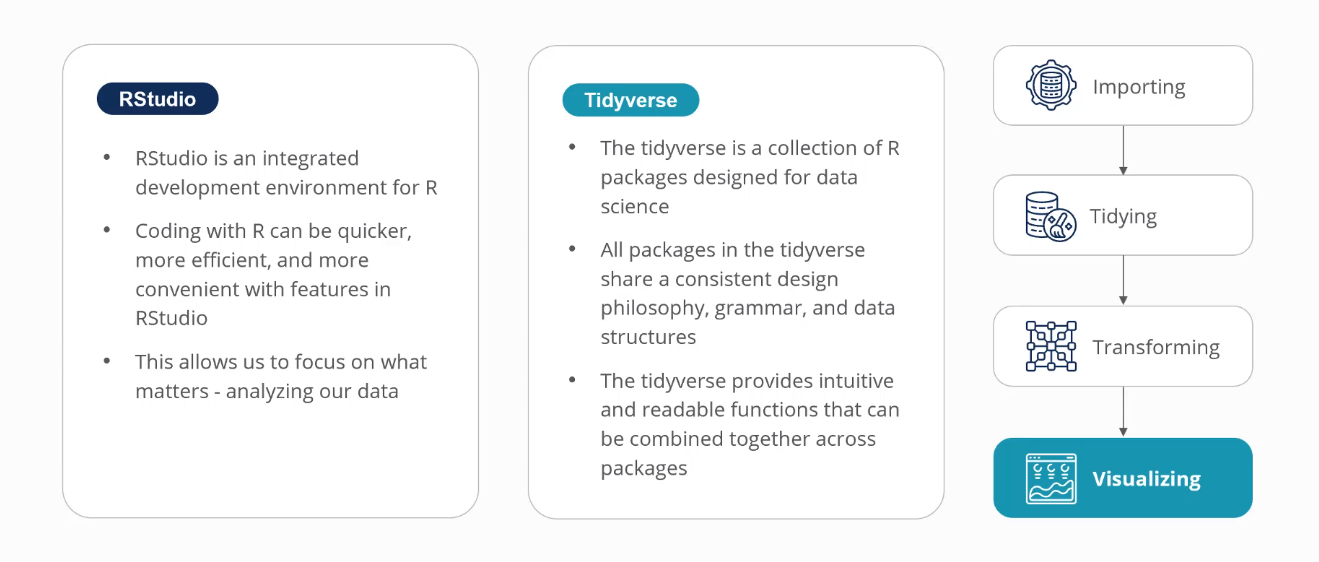
The most popular integrated development environment for programming with R is RStudio. The company that developed RStudio, Posit, has also developed the most widely used packages for data analysis: the tidyverse. Both are free solutions that enable us to get up and running with R quickly so that we can start solving real problems and seeing real value.
Finance professionals are increasingly turning to R programming because it’s ideal for data science, analysis, and visualization tasks. Data analysts can benefit from using R for both data analysis and data science. R is a great tool for analysts in any industry to use because R syntax is easy to read, and the work is reproducible.
The Base R functionality and the tidyverse packages make it easy to combine common data transformation and visualization functions together. This work can be easily shared with other team members using R Scripts or as part of a project in RStudio.
R is a great tool for data scientists because it was originally developed for statistical analysis and retains useful functions for data science work. RStudio and the tidyverse packages are all well-documented, widely used, and have a supportive community, so there are lots of different resources to get started or get assistance.
The core R functionality that is available once R is downloaded is known as Base R. Once R is installed, we can start programming with R right away using Base R syntax. The main areas of R syntax that are applicable to any project or analysis are:
Each of these areas are foundational to many programming languages. The examples used to demonstrate the syntax are taken from a chapter of BIDA’s R Fundamentals course.
Like virtually any other programming language, getting started with R programming is about understanding the basic operators. These include addition, subtraction, multiplication, and division, as well as logical operators such as less than, greater than, equivalent, and not equivalent. We can put these operators together into more complex operations by creating and (&) and or ( | ) statements. You can view a comprehensive list of R operators here.
Defining variables is another fundamental concept of R programming. R uses an arrow “<-“ to define variables. Variables are treated as vectors in R, meaning that we can refer to common data types of strings, numbers, and booleans. We can also combine multiple strings, numbers, or logical data points into a single variable by using the built-in concatenate function, c().
For instance, we can define:
x <- c(TRUE, FALSE)
When we then run str(x) to view the structure of x, we see the following output:
logi [1:2] TRUE FALSE
This means that our variable, x, is a logical vector with two values, true and false.
We can only concatenate similar data types, however.
For example, if we try to set:
y <- c(“hello”, 42, TRUE)
then run str(y), we get:
chr [1:3] “hello”, “42”, “TRUE”
Notice that the numerical and logical data have been turned into characters.
R makes working with data more easily and effectively by providing different ways to structure data. If we return to our previous example, instead of concatenating the three values into a single variable, we can use the data structure of a list.
z <- list(“hello”, 42, TRUE)

str(z)

$ : chr “hello”

$ : num 42

$ : logi TRUE
Now that the values are in a list instead of concatenated into a variable, they can each retain their own data type. R then lets us manipulate these lists.
Another even more powerful data structure in R is the data frame, which is a collection of name and vector pairs. Let’s make an example data frame of cities that are popular with tourists.
cities_df <- data.frame(

cities = c(“Vancouver”, “Kyoto”, “Toronto”, “Tokyo”, “Austin”, “Osaka”),
population = c(15, 100, 20, 500, 30, 400),

rating = c(3, 2, 5, 1, 5, 2)

)
Note that this data frame contains three vectors and each retains their own data type. Now let’s look at our data frame, its structure, and a single vector within it, the population.

Once we have a data frame, we can perform many mathematical functions on it that are built into R. The following examples of Base R syntax continue on from the previous example of the population and rating columns from the cities data frame.
| Type of Mathematical Operation | Base R Syntax |
|---|---|
| Summation | sum(cities_df$population) |
| Mean | mean(cities_df$population) |
| Standard Deviation | sd(cities_df$population) |
| Variance | var(cities_df$population) |
| Correlation | cor(cities_df$population, cities_df$rating) |
So far, all of the R syntax we have reviewed has been from Base R, the built-in functionality that is standard across the board. We can, however, expand that functionality with packages that others have built and published. Packages are meant to achieve specific goals and usually include sample datasets.
To get started installing packages, we can use the install.packages() function. For example, if we want to interact with Excel spreadsheets in R, we can use the readxl package. We can install the package with the following code:
install.packages(“readxl”)
Once the package is installed, we can access functions from that package by using the library(readxl) function.
Another package that can help with programming in RStudio is the “styler” package. The functions in this package help us to keep our coding style consistent across projects and aids collaboration.
There are hundreds of packages to choose from, making it fast and easy to achieve a wide variety of tasks with functions that were designed specifically for this instance.
The tidyverse is a collection of R packages designed for data science. All packages in the tidyverse share a consistent design philosophy, grammar, and data structures.
The tidyverse provides intuitive and readable functions that can be combined together across packages. This includes the ability to write code left to right with functions and function arguments that are readily consumable: named to explain what they do.
Connect what you just learned to a clear career path with CFI’s role‑based courses and certification programs.


