Bull Put Spread
An options strategy that involves purchasing out-of-the-money (OTM) put option and selling an in-the-money (ITM) put option with a higher strike price
What is a Bull Put Spread?
A bull put spread, which is an options strategy, is utilized by an investor when he believes the underlying stock will exhibit a moderate increase in price. A bull put spread involves purchasing an out-of-the-money (OTM) put option and selling an in-the-money (ITM) put option with a higher strike price but with the same underlying asset and expiration date. A bull put spread should only be used when the market is exhibiting an upward trend.
Key Highlights
- A bull put spread is an options strategy where an investor believes that the underlying stock will exhibit a moderate increase in price.
- A bull put spread involves purchasing an OTM put option and selling an ITM put option.
- In a bull put spread, the maximum gain is realized when the positions are initiated and faces potential losses as the strategy approaches maturity.
Formulas for Bull Put Spread
To determine the maximum loss and break-even point for a bull put spread, refer to the following formulas:

Note that when the bull put spread position is entered, the investor starts with the maximum gain and faces potential losses as the strategy approaches maturity. Following, we will go through a comprehensive example outlining this.
Understanding a Bull Put Spread
Consider the following example:
An investor utilizes a bull put spread by purchasing a put option for a premium of $15. The put option comes with a strike price of $80 and expires in July 2025. At the same time, the investor sells a put option for a premium of $35. The put option comes with a strike price of $120 and expires in July 2025. The underlying asset is the same for both put options and is currently trading at $95.
Summarizing the information above:

In writing the two options, the investor gets a cash outflow of $15 from purchasing a OTM put option and a cash inflow of $35 from selling an ITM put option. Netting the amounts together, the investor generated an initial cash inflow of $20 from the two put options.
Now, assume that it is July 2025. The table below illustrates theoretical stock prices at the expiration date.

At a price of $120 or above, the investor’s gain is capped at $20 because both the long put option and the short put option are out-of-the-money. For example, at the stock price of $125, the investor would gain nothing from their long put option lose nothing from their short put option.
At a price of $80 or below, the investor’s loss is capped at $20 because both the long put option and the short put option are in-the-money. For example, at the stock price of $75, the investor would gain $5 from their long put option and lose $45 from their short put option. Adding in the $20 that the investor would have gained on their net premium, the investor would be left with a net loss of $20.
Therefore, in a bull put spread, the investor is limited to a maximum loss equal to the strike price of the short put minus the strike price of the long put plus net premiums received.
- Applying the formulas for a bull put spread:
- Maximum profit = $20
- Maximum loss = $120 – $80 – $20 = $20
- Break-even point = $120 – $20 = $100
The values calculated correspond to the table above.
Visual Representation
The comprehensive example above can be visually represented as follows:
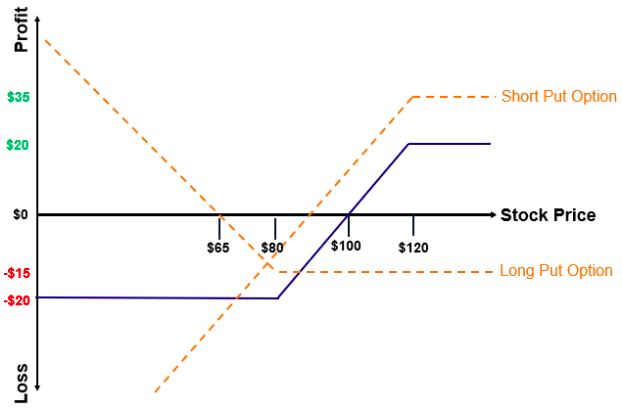
Where:
- The blue line represents the pay-off; and
- The dotted yellow lines represent the long put option and the short put option.
Note that the blue line is simply a combination of the two dotted yellow lines.
The payout table below corresponds to the visual graph above.

Example of a Bull Put Spread
Jorge is looking to utilize a bull put spread on ABC Company. ABC Company is currently trading at a price of $150. He purchases an out-of-the-money put option for a premium of $10. The strike price for this option is $140 and expires in January 2030. Additionally, Jorge sells an in-the-money put option for a premium of $30. The strike price for the option is $180 and expires in January 2030.
What are the maximum payout, maximum loss, and break-even point of the bull put spread above?
The net premium is $20 ($30 OTM Put – $10 ITM Put).
Applying the formulas for a bull put spread, Jorge determines:
- Maximum profit = $20
- Maximum loss = $180 – $140 – $20 = $20
- Break-even point = $180 – $20 = $160
To confirm, Jorge creates a payout table:

Benefits and Drawbacks from Using a Bull Put Spread
The main reason behind using a bull put spread is to immediately realize the maximum profit upon executing the spread. In the example above, Jorge is able to realize a maximum profit of $20 immediately into executing a bull put spread. In addition, although the maximum gains are capped, the investor is protected from downside risk as well.
However, one significant drawback from a bull put spread is that potential gains are limited. For example, in the example above, the maximum gain Jorge can realize is only $20 due to the short put option position. Even if the stock price were to decline to $0, Jorge would only be able to realize a gain of $20.
Related Readings
CFI is the official provider of the Capital Markets & Securities Analyst (CMSA)® certification program, designed to transform anyone into a world-class financial analyst.
To keep learning and developing your knowledge of financial analysis, we highly recommend the additional resources below:


