Get Certified for
Capital Markets (CMSA®)
From equities and fixed income to derivatives, the CMSA certification bridges the gap from where you are now to where you want to be — a world-class capital markets analyst.
A chart that depicts the relationship between swap rates and available maturities
The swap rate curve is a chart that depicts the relationship between swap rates and all available corresponding maturities. Essentially, it indicates the expected returns of a swap on different maturity dates. The curve can be considered as the swap’s equivalent of a bond’s yield curve, and is a par curve, as it is based on par swaps.
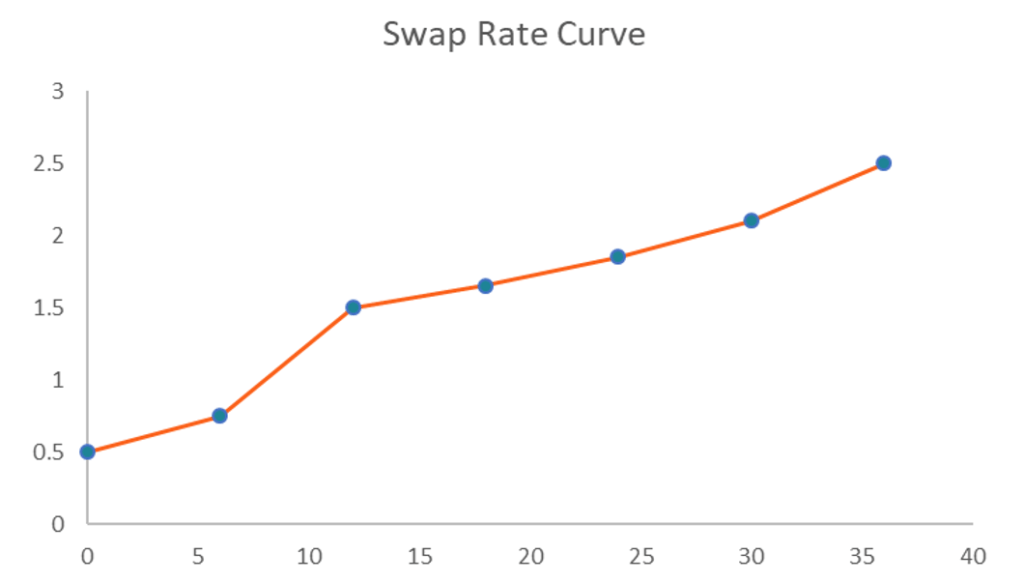
The swap rate curve is a two-dimensional plot drawn against the x-axis and y-axis. The swap rates are plotted against the y-axis while the times to maturity are drawn on the x-axis. Generally, the curve is upward sloping, since long-term swap rates tend to be higher than short-term rates.
The swap rate curve is frequently drawn together with the yield curve of a government bond (e.g., US Treasury securities). In some cases, the two curves may coincide, but they often diverge from each other. If the two curves diverge from each other, the swap spread is presented. Historical data shows that the swap rate curve tends to be above the yield curve, thus indicating positive swap spreads.
The swap rate curve is extensively used in financial markets. For example, it is frequently used as a benchmark for interest rates. In addition, the curve can be utilized to assess market participants’ sentiment regarding the prevailing market conditions (particularly risk).
The curve can be easily created using Microsoft Excel. It can be done by following the steps below:
Swap contracts are traded in Over-The-Counter Markets (OTC). As a swap contract comprises two legs, we must determine the present value of both legs to determine the value of the swap contract.
The fixed leg of interest rate swap contract, for example, is fairly simple to calculate, as future cash flows are set at inception. The floating leg requires a more complex calculation, as it is subject to change with the fluctuation of interest rates. The forward rate curve must be used to determine the forward rate of each future floating payment.
More Resources
CFI offers the Capital Markets & Securities Analyst (CMSA)® certification program for those looking to take their careers to the next level. To keep learning and advancing your career, the following CFI resources will be helpful:
To master the art of Excel, check out CFI’s Excel Crash Course, which teaches you how to become an Excel power user. Learn the most important formulas, functions, and shortcuts to become confident in your financial analysis.

Launch CFI’s Excel Crash Course now to take your career to the next level and move up the ladder!


