Get Certified for
Capital Markets (CMSA®)
From equities and fixed income to derivatives, the CMSA certification bridges the gap from where you are now to where you want to be — a world-class capital markets analyst.
Occurs when a firm operates or produces output that is less than the optimum capacity
Excess capacity (or unutilized capacity) occurs when a firm operates or is producing output at less than the optimum level. It can happen when there is a market recession or increased competition, where demand declines and firms are forced to reduce capacity to decrease costs.

To increase demand, companies typically decrease prices when there is excess capacity in the industry. Excess capacity is determined using the minimum long-run average cost; hence, it is not a short-run occurrence.
Economists normally study excess capacity in the context of market structures – perfect competition and monopolistic competition – which we will examine below.

Where:
Conditions of full equilibrium in a perfectly competitive market structure are reached when the demand curve (AR) is tangential to the long-run average cost curve (LAC) at its minimum point. This is also the point where the LMC = AR = MR = LAC.
The equation signifies that in the long run, despite the entry of new firms in the market, existing firms make efficient use of available resources to operate at the lowest point of the LAC.
Therefore, in the long run, the optimum output is OQ, and at the equilibrium point (E), all firms earn normal profits; abnormal profits are unattainable.
At E, where price (OP) and optimum output at the efficient scale (OQ), MR = LMC – AR = LAC. Consequently, there is no excess capacity in the long run for perfectly competitive markets.
Excess capacity is more defined under monopolistic competition due to the nature of the market structure.
Unlike perfectly competitive markets where the demand curve is horizontal, monopolistic competitive markets show a downward sloping demand curve. The demand curve cannot be tangential to the LAC at its minimum point.
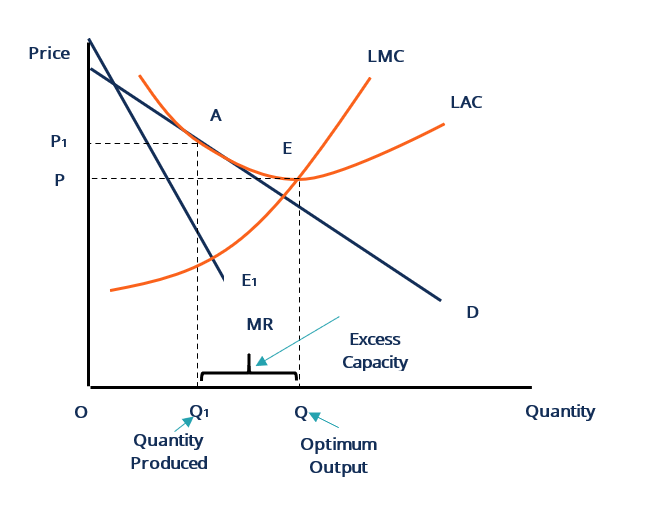
Conditions of equilibrium are reached at E, where LMC = LAC at the minimum point of the latter. Firms in monopolistic competition are likely to see excess capacity, as there is no incentive to produce optimum output at a higher long-run marginal cost (LMC) that is greater than marginal revenue (MR).
Firms in monopolistic competition operate below optimum capacity; hence, they are smaller in size, larger in terms of population, and work under conditions of excess capacity.
Firms under monopolistic competition operate at the equilibrium point E1, where output OQ1 is produced, and the demand curve is tangent to the LAC at point A. It is the point where the LMC curve intersects the MR curve.
Firms do not operate at equilibrium (E), where the LMC curve intercepts the LAC curve at its lowest point, and optimum output (OQ) is produced. Beyond OQ1, firms will start incurring losses as LMC exceeds MR. Thus, excess capacity is created as represented by Q1Q.
The graph also reveals that in the long run, output is lower, and price is higher under monopolistic competition, compared to perfectly competitive markets, where output is higher, and price is lower.
The concept was explained by Prof. Chamberlin. He indicated that under monopolistic competition, with freedom of entry and price competition, the tangency of the demand curve and the long-run average cost curve would yield an optimal output and no excess capacity.
Furthermore, consumers are willing to pay a higher price for differentiated products and the increase in the variety of goods. Excess capacity arises from non-price competition despite the freedom of entry in a monopolistic competition market structure.
Chamberlin indicated that firms use the cost of production rather than demand when pricing their products, and they will aim to earn normal profits. Firms are generally unwilling to reduce product prices.
In addition, firms focus on product differentiation to dissuade attention from price competition. Some will also be led by business ethics to avoid cut-throat price competition.
Prof. Chamberlin’s excess capacity concept assumes the following:

Firms earn abnormal profits at initial short-run equilibrium point S and price (OP), which is above the long-run average cost (LAC) curve. However, the entry of new firms in the market will eventually wipe away abnormal profits.
The imaginary demand curve dd is of no material importance if there is no price competition. The entry of new firms will push the demand curve DD to the left, where it becomes D1D1 and is also tangent to the LAC curve at point G.
At this point, all firms are earning normal profits at the price (OP) and output (OQ). To note, however, is that OQ is output achieved in the absence of price competition.
The optimum output is OQ1, where excess capacity does not exist as each firm’s demand curve d2d2 is tangent to the LAC at point H, the lowest possible point on the curve under price competition.
However, each firm produces OQ in the absence of price competition. Therefore, output OQ1 signifies excess capacity due to non-price competition. In the long run, prices and costs are governed by excess productive capacity.
Chamberlin indicated that although the optimal output is greater than the actual output under monopolistic competition, it should not be termed inefficient; rather, it is the price consumers pay for product differentiation.
He further outlined that the difference between OQ and OQ1 is a measure of the cost of product differentiation rather than excess capacity. Hence, the conditions for optimum output under monopolistic competition are freedom of entry and non-price competition.
Excess capacity is often caused by fixed prices, but when prices are flexible, the entry of new firms causes an increase in price elasticity of demand, which lowers prices and, subsequently, profits. Prices will be more than costs, and profits are likely to stay at the same level if consumer apathy exists.
The degree of excess capacity is primarily dependent on:
The absence of price competition between firms has various reasons, as given by Chamberlain and includes the following:
These factors often lead to excess capacity in imperfect markets.
There are two main causes of excess capacity under monopolistic competition:
The demand curve can only be tangential to the LAC when the LAC is falling. Hence, only the horizontal demand curve under perfect competition can be tangential to the LAC at its lowest point.
The downward-sloping shape of the demand curve is caused by product differentiation. Hence, the greater the elasticity of demand for a firm under monopolistic competition, the less the excess capacity. Under perfect competition, where demand is perfectly elastic, there is no excess capacity.
It also causes excess capacity in the long run, as illustrated by Chamberlin. New entrants are attracted by abnormal profits earned by firms in the short run.
As firms continue to enter the market, the industry is reduced to earning normal profits. Each firm produces less than its optimum capacity due to the sharing of market demand.
Excess capacity under monopolistic competition arises from product differentiation that creates product variety and quality, which benefits consumers. Consumers generally do not prefer homogenous products. Technically, excess capacity increases consumer satisfaction.
Excess capacity in manufacturing sectors of industrialized economies is caused by demand or supply factors. It is mostly attributable to demand factors due to reduced demand globally or from home because of business cycles and other demand-induced factors.
However, excess capacity can also be attributable to supply-side factors such as continued rapid growth in fixed-asset investment, which increases manufacturing capacity and crowds out consumption.
The relationship between supply and demand weakens, and this results in overinvestment and excess capacity. Common remedies for eliminating excess capacity in the real world are as follows:
Monetizing excess capacity is a prudent way to unlock revenue for the firm and is also good for society. The main strategy is to focus on non-cash transactions and on technology. Here is a list of ways to monetize excess capacity:
Connect what you just learned to a clear career path with CFI’s role‑based courses and certification programs.
CFI is the official provider of the global Capital Markets & Securities Analyst (CMSA®) certification program, designed to help anyone become a world-class financial analyst. To keep advancing your career, the additional CFI resources below will be useful:


