Get Certified for
Capital Markets (CMSA®)
From equities and fixed income to derivatives, the CMSA certification bridges the gap from where you are now to where you want to be — a world-class capital markets analyst.
A contour line where utility remains constant across all points on the line
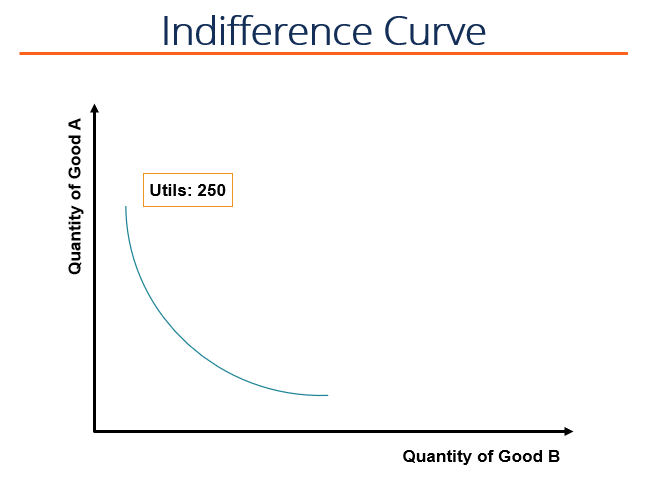
An indifference curve is a contour line where utility remains constant across all points on the line. In economics, an indifference curve is a line drawn between different consumption bundles, on a graph charting the quantity of good A consumed versus the quantity of good B consumed. At each of the consumption bundles, the individual is said to be indifferent.

When an individual consumes goods and services, the satisfaction gained or lost from consumption is called utility. Consumer preferences are defined by the consumption bundles that consumers face. A collection bundle is a bundle that maximizes the consumer’s total utility, given the consumer’s budget constraints. One unit of utility is known as a util.
Marginal utility refers to the utility gained from the consumption of an additional unit of a good or service.
The principle of diminishing marginal utility is illustrated here as the total utility increases at a diminishing rate with additional consumption. It is evidenced by figures D, E, and F having decreased marginal utility. Therefore, the principle of diminishing marginal utility indicates that each additional unit of consumption adds less to the cumulative utility than the previous unit.

An indifference curve is a contour line along which utility remains constant across all points on the curve. Each point on an indifference curve represents a consumption bundle, and the consumer is indifferent among all consumption bundles on the indifference curve. In our example, the consumer yields 250 utils.
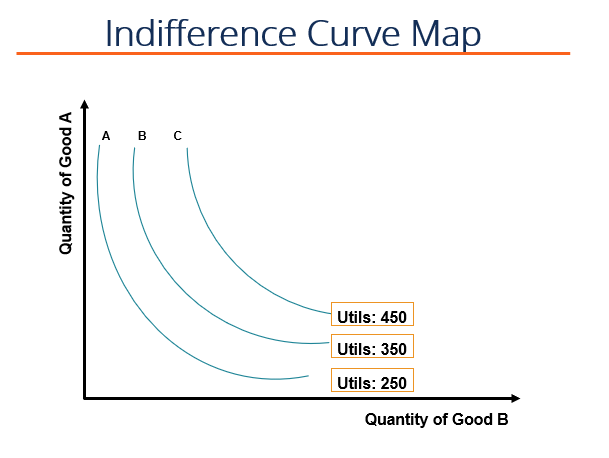
An entire utility function can be graphically represented by an indifference curve map, where several indifference curves correspond to different levels of utility. In the graph below, there are three different indifference curves, labeled A, B, and C. The farther from the origin, the greater the utility is generated across all consumption bundles on the curve.
If a good satisfies all four properties of indifference curves, the goods are referred to as ordinary goods. They can be summarized as the consumer requires more of one good to compensate for less consumption of another good, and the consumer experiences a diminishing marginal rate of substitution when deciding between two goods.
As you go down the curve of an indifference curve, the curve becomes flatter as one good is substituted for the other. It is the individual’s marginal rate of substitution, which is defined as the more an individual consumes good A in proportion to good B, the less of good B the individual will substitute for another unit of good A.
In the graph below, point A illustrates the tangency condition the utility curve has with the budget line constraint.
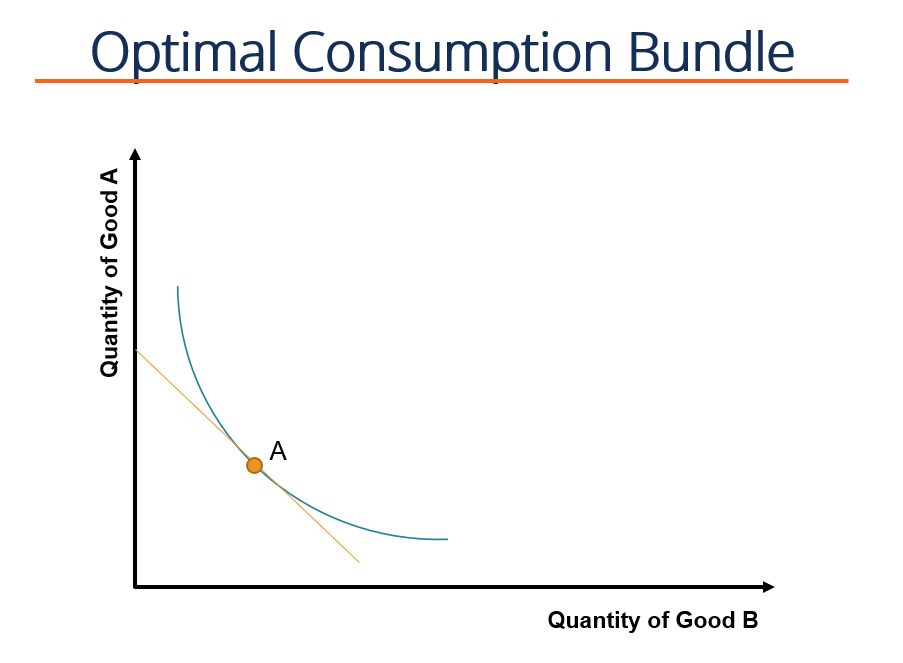
The tangency condition between the indifference curve and the budget line indicates the optimal consumption bundle when indifference curves exhibit typical convexity.
The slope of the budget line is the relative price of good A in terms of good B, equal to the price of good A as a ratio of the market price of good B. Moreover, the slope of the budget line subtracted by the relative price represents the opportunity cost of consumption. There is an opportunity cost because of the consumer’s limited budget. The budget line is shifted outwards by the price of goods becoming proportionally cheaper.
The slope of the indifference curve at any point is the negative marginal utility of good A as a proportion of the marginal utility of good B. It indicates that the optimal consumption bundle – the marginal rate of substitution between goods A and B – is the ratio of their prices.
Connect what you just learned to a clear career path with CFI’s role‑based courses and certification programs.
Thank you for reading CFI’s guide to the Indifference Curve. To keep advancing your career, the additional resources below will be useful:


