Get Certified for
Capital Markets (CMSA®)
From equities and fixed income to derivatives, the CMSA certification bridges the gap from where you are now to where you want to be — a world-class capital markets analyst.
A measure of the level of economic activity in the U.S. manufacturing sector
The ISM Manufacturing Index, commonly known as the ISM Manufacturing Purchasing Managers Index (ISM PMI), is a monthly gauge of the level of economic activity in the manufacturing sector in the United States versus the previous month.
The ISM Manufacturing Index is published at the beginning of each month at 10 a.m. Eastern Time by the Institute for Supply Management (ISM), a not-for-profit organization professional supply management organization based in Arizona, USA.
Founded in 1915, the ISM was formerly known as the National Association of Purchasing Management, Inc. (NAPM) until 2002, when the organization was renamed the ISM.
The ISM Manufacturing Index is published monthly and is an important leading indicator of the U.S. economy. The reason that this economic indicator is forward-looking is how far ahead purchasing decisions need to be made for future manufacturing needs. As such, it is widely followed by economists, analysts, government, business leaders, and supply management professionals.
The index is based on a survey of purchasing and supply executives (i.e., individuals who are responsible for their firm’s supply chains) in over 400 manufacturing companies, representing 20 different industries across all 50 states out of the more than 50,000 members of the ISM. Survey participants are asked whether conditions have improved or deteriorated in 10 specific areas, or subindexes:
The raw results are then compiled from the first five of the sub-indexes with equal weightings to form the ISM Manufacturing Index.
Through monitoring the ISM Manufacturing Index and comparing it to consensus estimates, investors gain a better understanding of economic trends and conditions. As a result, any deviation from consensus is viewed as a surprise, providing investors with a trading opportunity.
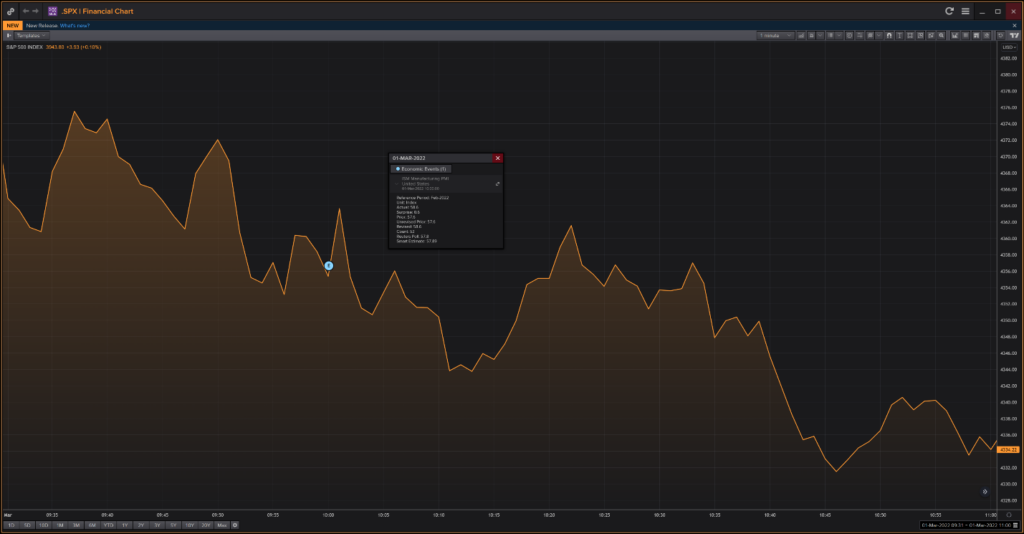
A higher-than-expected reading is bullish for the stock market but bearish for the bond market, and the opposite is true. When the index is greater than expected, it bodes well for the stock market because it indicates healthy economic growth, which translates to higher corporate profits.
On the contrary, the index expanding greater than expected translates poorly for the bond market because it may provide an indication of potential inflationary pressures. As an example, the following shows a positive reaction from the S&P 500 Index on a stronger than expected ISM Manufacturing Index for the month of February 2022 (Estimate: 58.0, Actual: 58.6), which was released on March 1, 2022:
Survey respondents are broadly diversified across industries based on the North American Industry Classification System (NAICS). The number of survey respondents within each industry varies depending on that industry’s share of the U.S. GDP.
The 18 industries represented include Food, Beverage & Tobacco Products; Textile Mills; Apparel, Electric Equipment, Appliances & Components, Transportation Equimentment, Primary Metals, Computer & Electronic Products, Petroleum & Coal Products, and Fabricated Metal Products, among others.
To collect data for the index, purchasing and supply executives in the various industries are surveyed on whether the ten economic activity indicators (New Orders, Production, Employment, Inventories, Supplier Deliveries, Customers’ Inventories, Prices, Backlog of Orders, New Export Orders and Imports) at their firm have moved in the positive economic direction (higher, better and slower for Supplier Deliveries) or negative economic direction (lower, worse and faster for Supplier Deliveries) versus the previous month.
For each economic activity indicator, a diffusion index is calculated, as follows:
% Positive Responses + ½ * (% Neutral Responses)
For the ISM Manufacturing Index, the calculation involves a 20% equally weighted summation of diffusion indexes of these five components:
An example is provided below:
The following shows survey participant responses on each component of the ISM Manufacturing Index:
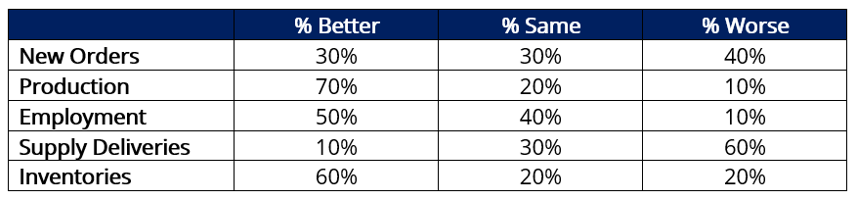
The ISM Manufacturing Index based on the above table would be calculated as follows:
20% * [30% + (½ * 30%)] +
20% * [70% + (½ * 20%)] +
20% * [50% + (½ * 40%)] +
20% * [10% + (½ * 40%)] +
20% * [60% + (½ * 20%]] = 58
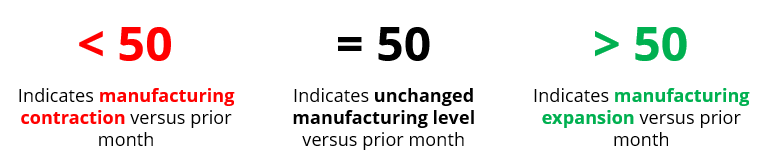
As a result, the interpretation of an ISM Manufacturing Index of 58 would be that economic activity in the manufacturing sector in the United States expanded compared to the prior month.
Members also provide more anecdotal feedback that is included in the monthly PMI report.
Connect what you just learned to a clear career path with CFI’s role‑based courses and certification programs.
Thank you for reading CFI’s guide to the ISM Manufacturing Index. To keep learning and developing your knowledge, we highly recommend the additional resources below:


