Get Certified for
Capital Markets (CMSA®)
From equities and fixed income to derivatives, the CMSA certification bridges the gap from where you are now to where you want to be — a world-class capital markets analyst.
A period of initial decline followed by a rise to a point higher than the starting point
A J Curve is a chart where the line plotted falls at the beginning and rises gradually to a point higher than the starting point, forming the shape of the letter J. It reflects a phenomenon in which a period of unfavorable returns is followed by a period of gradual recovery that rises to a higher point than the starting point.
The phenomenon applies across a variety of fields, including private equity funds, economics, medicine, and political science.
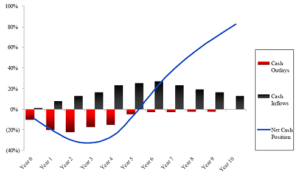
For example, if you plot the performance and cash flows of private equity funds, the chart will follow the shape of a “J.” Private equity funds focus on the premise that the internal rate of return of an investment drops at the beginning until a level of stability is attained, after which the business can enter a profitable state.
In private equity, the J Curve represents the tendency of private equity funds to post negative returns in the initial years and then post increasing returns in later years when the investments mature. The negative returns at the onset of investments may result from investment costs, management fees, an investment portfolio that is yet to mature, and underperforming portfolios that are written off in their early days.
Typically, private equity funds do not take possession of their investor’s funds until they’ve identified profitable investments. The investors just commit to providing funds to the fund manager as needed or upon request. Banks that lend to private equity funds negotiate for a cash flow sweep that requires the fund to pay down its debt with some or all of the excess cash flow generated.
In the initial years, the private equity fund generates little or no cash flow for the investors, and the initial funds generated are used to reduce the company’s leverage. This concept requires extensive financial modeling and a financial analyst at a PE fund will have to build an LBO model for the deal.
If the fund is well managed, it will begin experiencing unrealized gains followed by events in which the gains are realized. Leveraged IPOs, mergers and acquisitions, and buyouts result in increased returns to the fund, which produce the J Curve shape. First, the excess cash will pay down the debts, then any extra cash will go to the equity investors.
The J Curve incline is determined by the returns generated, and how quickly these returns get back to the investors. A steep curve represents a fund that generated the highest returns in the shortest time possible, while a curve with a slow rise represents a poorly managed private equity fund that took too long to realize returns and only generated low returns.
In economics, a J Curve refers to a change in the country’s balance of trade, often following a currency devaluation or depreciation. A weak currency means that imports will be costly, while it will be more profitable to export commodities. The imbalance leads to a fall in the current account, hence a smaller surplus or a bigger deficit.
Immediately after the devaluation of a currency, there will be a lag in changing the consumption of imports. The demand for expensive imports and the demand for cheaper exports will be unchanged in the short run, as consumers look for cheaper alternatives.
The long-term implication of currency devaluation or depreciation is that local consumers will switch to comparably cheaper locally-produced products. Also, foreign traders will purchase more products that are being exported to their country. The products exported to their country are relatively cheaper due to the weakened currency value. At this stage, the country experiences the desired outcome of improving the current account balance. The J Curve forms when the country’s currency depreciates, and the value of exports becomes less expensive than the value of imports.
Connect what you just learned to a clear career path with CFI’s role‑based courses and certification programs.
CFI is the official provider of the global Capital Markets & Securities Analyst (CMSA)® certification program, designed to help anyone become a world-class financial analyst. To keep advancing your career, the additional CFI resources below will be useful:


