Accumulation/Distribution Indicator (A/D)
An indicator used to analyze the extent of accumulation (demand) and distribution (supply) of a stock
What is the Accumulation/Distribution Indicator (A/D)?
The accumulation distribution indicator (AD) or accumulation distribution line is a volume-based indicator used to determine the trend of a stock, using the relation between the stock’s price and volume flow. The term “accumulation” denotes the level of buying (demand), and “distribution” denotes the level of selling (supply) of a stock. Hence, based on the supply and demand pressure of a stock, one can predict the stock’s future price trend.
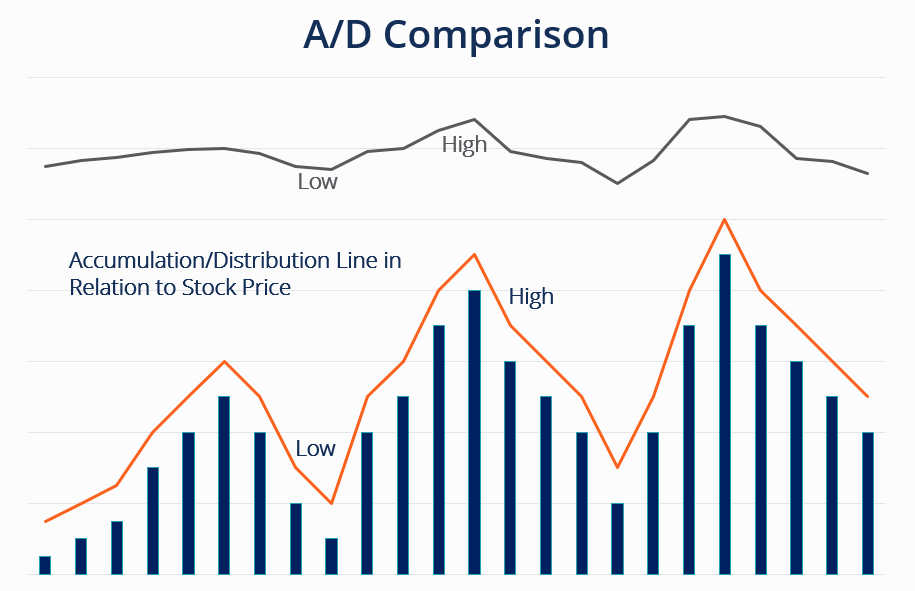
The above figure represents the accumulation/distribution (A/D) comparison chart of a stock for a period. The orange line is the stock price variation over the period, and the grey line is the A/D line for the same period. As you can see, the A/D line is relative to the stock price. When the stock price was low, the A/D indicator was low, and when the stock price was high, the A/D indicator was high.
Accumulation/Distribution Formula
The accumulation distribution formula comprises three components:
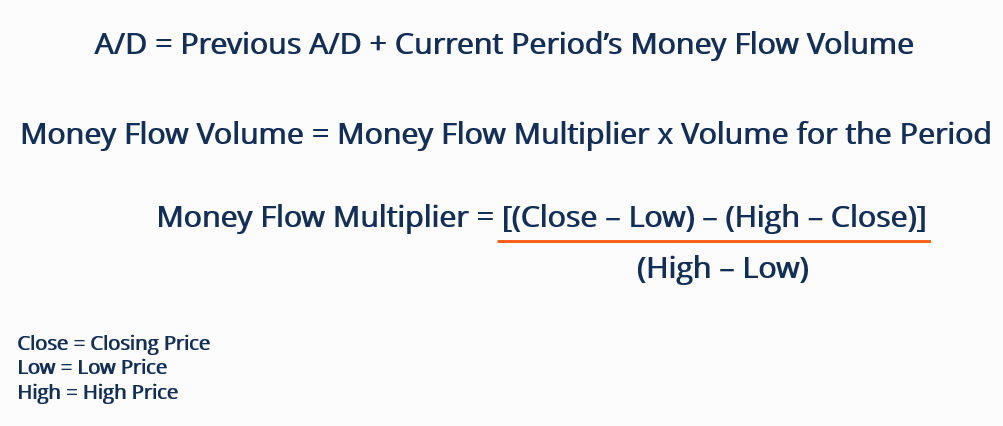
The money flow multiplier is in the range of +1 and -1. If the stock’s closing price is in the upper half of the High-Low, then the multiplier is positive and negative when the closing price is in the lower half. The money flow multiplier value represents the buying-selling pressure of the stock. The multiplier will be positive if the buying pressure is stronger than the selling pressure (more in demand) and vice versa.
Since the accumulation distribution indicator is a cumulative measure, the previous A/D value is added to the current period’s money flow volume to get the current A/D value. Money flow volume is the first A/D value. The money flow volume, combined with the previous A/D value, confirms the current price trend and helps predict the sustainability of the current trend.
How the Accumulation/Distribution (A/D) Indicator Works
The primary rule of the A/D indicator is that stock volume precedes stock price. The number of shares traded is relative to the rise and fall of its stock price. The A/D indicator, like other volume indicators, predicts the direction of the volume flow. It helps determine future stock price movements and hence provides an edge.
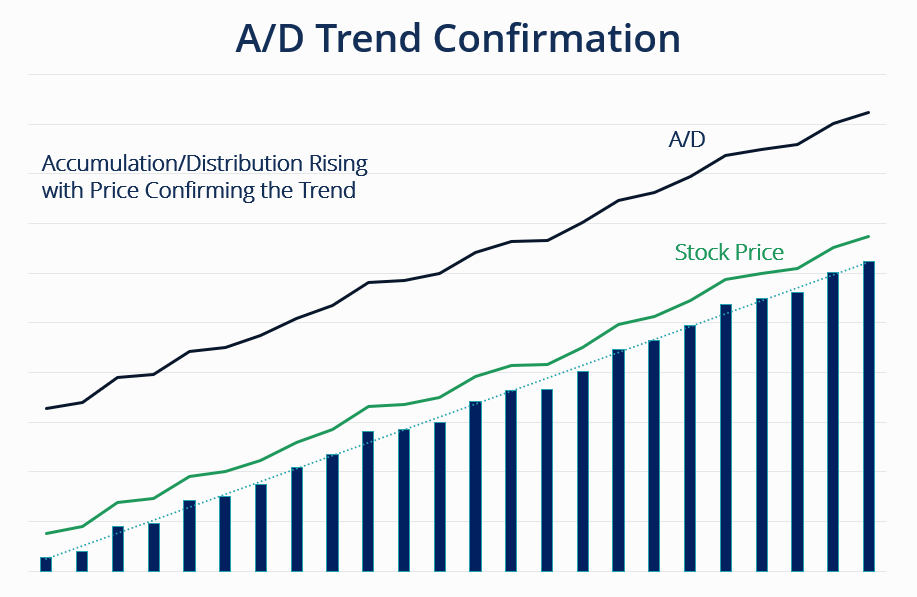
- When the stock price and A/D indicator both make high peaks and high troughs, the upward trend is likely to continue.
- When the stock price and A/D indicator both make low peaks and low troughs, the downward trend is likely to continue.
- For a given period, if the A/D indicator is rising, then accumulation (buying pressure) may be higher and is a sign of the future upward breakout.
- For a given period, if the A/D indicator is falling, then distribution (selling pressure) may be higher and is a sign of the future downward breakout.
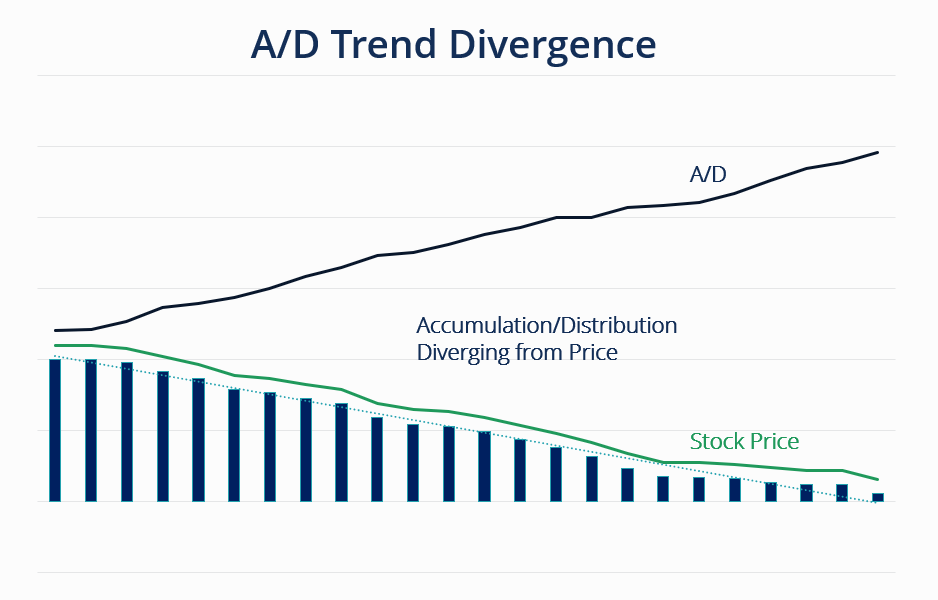
- When the stock price continues to rise while accumulation distribution falls, the upward trend is likely to stall. It is called negative divergence.
- When the stock price continues to fall while accumulation distribution rises, the downward trend is likely to stall. It is called positive divergence.
Accumulation/Distribution Indicator vs. On-Balance Volume
Financial writer Joe Granville developed on-balance volume (OBV) to measure the cumulative volume flow of a stock. Both the A/D indicator and OBV are volume-based indicators but with different approaches. OBV adds a period’s total volume if the stock closes at a higher price than the previous close and subtracts if it closes at a lower price. The total of the positive-negative volume flow forms the OBV line, which is used as a comparison indicator of confirmation or divergence for the stock price.
The accumulation distribution indicator does not factor in the previous close. Instead, it focuses on the proximity of the closing price relative to the stock’s high-low range for the given period (day, week, or month).
Advantages and Disadvantages of the A/D Indicator
The accumulation distribution indicator is a good means to assess the volume force behind the pricing move. The A/D indicator can determine the buying and selling pressure of stock in the market and, based on that, can offer insights about potential stock price changes. Hence, one can estimate the trading position as per potential price movements. The A/D line also spots price-volume divergences, which help traders confirm the trend’s strength and sustainability.
Yet, there are some drawbacks to using the accumulation distribution indicator. The A/D indicator does not state changes in price between periods; hence, a series of price gaps may go undetected. Since the A/D line ties with the price movements for a period, it can cause a disconnect between the stock price and the indicator.
Hence, the accumulation distribution indicator must be used along with other aspects of technical analysis and not as a standalone indicator.
Connect what you just learned to a clear career path with CFI’s role‑based courses and certification programs.
Additional Resources
CFI offers the Capital Markets & Securities Analyst (CMSA)™ certification program for those looking to take their careers to the next level. To keep learning and advancing your career, the following resources will be helpful:


