Advance Decline Ratio
The number of stocks that increased in value compared to the number of stocks that decreased in value
What is the Advance Decline Ratio?
The advance decline ratio (ADR) is a technical indicator used to assess stock market sentiment. The ratio compares the number of stocks that increased in value to the number of stocks that decreased in value. In other words, the ADR compares the number of stocks that rose in price versus the number of stocks that declined in price.
Formula for the Advance Decline Ratio
The formula for the advance decline ratio is as follows:

Where:
- Number of Advancing Stocks refers to the number of stocks that increased in value; and
- Number of Declining Stocks refers to the number of stocks that declined in value.
Note: The ratio can be used for any desired timeframe. For example, a trader can use the ADR over a one-day period, a one-month period, or a one-year period.
Example of the Advance Decline Ratio
An investor is looking to determine the market sentiment on a specific date. To do so, the trader gathers the information shown below. Assume that the stocks shown below are representative of the market. What is the advance decline ratio?
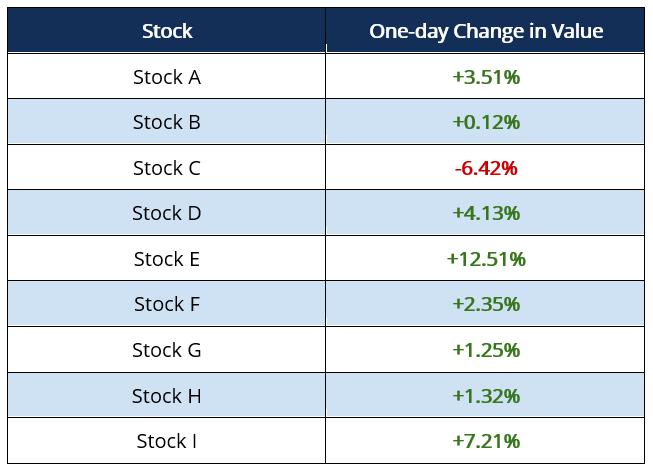
With the nine stocks above, eight stocks increased in value while one stock decreased in value. As such, the advance decline ratio is 8 / 1 = 8.
Interpreting the Advance Decline Ratio
The advance decline ratio can be looked at on a trended basis or by itself.
1. On a trended basis
Looking at the advance decline ratio on a trended basis provides an indication as to whether the market is expected to show a bullish or bearish trend. A ratio that is increasing over time signals a bullish market trend while a ratio that is declining over time signals a bearish market trend. For example, consider the ADR over a 10-day period (the ratio is taken once a day):
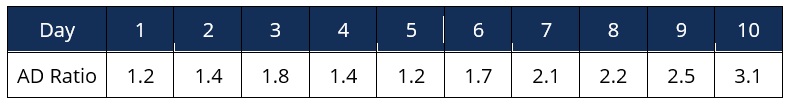
Although the ADR dipped on days four and five, the 10-day trend of the ratio points upwards. As such, to an investor, it may signal bullish momentum.
2. By itself
Looking at the advance decline ratio by itself provides an indication as to whether the market is oversold or overbought. A ratio that is relatively high signals an overbought market while a ratio that is relatively low signals an oversold market. For example, assume the 15-day moving average ADR was 1. The next day, the ADR was 4.3. As such, the ratio is high relative to the 15-day moving average and signals an overbought market.
It is important to keep in mind that it is uncommon for traders to use the ADR as the sole technical indicator when making trading decisions. The ratio should be used in conjunction with other technical indicators and fundamental analysis when forming a trading decision.
ADR in the News
The number of advancing stocks, declining stocks and unchanged stocks for major U.S. indices can be found on The Wall Street Journal.
For example, on August 5, 2019, U.S. President Trump accused China of manipulating its currency by weakening the yuan to make Chinese exports cheaper. On that day, using the information provided by The Wall Street Journal, the ADR for the New York Stock Exchange (NYSE) was 0.1057 (288/2,724).
More Resources
CFI offers the Financial Modeling & Valuation Analyst (FMVA)™ certification program for those looking to take their careers to the next level. To keep learning and advancing your career, the following resources will be helpful:


