Get Certified for
Capital Markets (CMSA®)
From equities and fixed income to derivatives, the CMSA certification bridges the gap from where you are now to where you want to be — a world-class capital markets analyst.
The most common and important Bloomberg shortcuts and functions
To be more productive, faster, and more efficient when performing financial analysis or research, it’s important to be proficient at using the Bloomberg Terminal. That means knowing the most important Bloomberg functions.
Whether you work in investment banking, equity research, or other areas of the capital markets, you’ll have to learn how to use the Bloomberg Terminal for grabbing historical financial information about a company, share prices, transactions, bonds/fixed income information, and much more.
Here we have compiled a list of what we believe are the most common and important functions, keystrokes, and shortcuts to know on the Bloomberg Terminal, inside and out. Bloomberg functions mastery is key to becoming a great financial analyst.
The top news functions include:
| Shortcut | Description | Uses |
|---|---|---|
| N | News | Main News menu |
| TOP | Top News Stories | Filtered view of the News function, shows headlines of the day's top stories from BLOOMBERG NEWS |
| TOPCA | Top News Stories Canada | Filtered view of the News function, shows headlines of the day's top stories from BLOOMBERG NEWS for Canada |
| NSE | News Item Search | Custom news search |
| NSE CNS | Canadian Stock Markets | Filtered custom news search constrained to Canada |
| NSE USS | U.S. Stock Markets | Filtered custom news search constrained to US |
| NSE MNA | Mergers/Acquisitions | Filtered custom news search constrained to Mergers and Acquisitions |
| NSE OPN | Opening Market Commentary | Filtered custom news search constrained to Opening Commentaries |
| NSE US COS | Corporate News | Filtered custom news search constrained to US and Corporate News |
| NSE BBEA | Earnings Up & Downgrades | Filtered custom news search constrained to Earnings and Downgrades |
The top broad market screening functions include:
| Shortcut | Description | Uses |
|---|---|---|
| WEI | World Equity Indices | Allows you to monitor and compare real-time price and volume data for the world's equity indices. |
| WPE | World P/E | Allows you monitor and analyze key fundamental ratios, such as price/earnings, across major equity indices and compare intra-day index level ratios against analyst estimates and other regions. |
| ECO CA | Canadian (& U.S.) Economic Releases | Economic calendars of real-time and upcoming economic releases, commodity, government, central bank and industry data, and events. |
| ECST | Economic Statistics by Country | Provides economic data with organization and context and allows to analyze multiple datasets using graphical and table formats. |
| MOV | Index & Industry Group Movers | Shows stocks that drive the movement of a selected index or other equity group. |
| MA | Merger/Acquisition Database | Allows tracking and analyzing mergers and acquisitions data in real time and easily filter for deals by a range of dimensions, such as deal type, size, and adviser. Also allows finding deal-level data. Additionally, allows searching for comparable transactions. |
| WFX | Cross Currency Rate Monitors | Gives an overview of currency rates in real time, also provides information on pricing hours for better monitoring. |
| FXC | Currency Rates Matrix | Allows monitoring cross currency spot, forward, and fixing rates. |
| RATC | Rating Revisions Monitor | Displays a list of current and historical credit ratings for up to 10,000 issuers, allowing to track upgrades, downgrades, and other moves that reflect the issuer's fiscal strength and degree of risk. |
| BTMM | Interest Rates & the Bond Market | Shows all major rates, securities, and economic releases for a selected country. |
| USSW | Treasury I Swaps Monitor pages | Provides current interest rate swap rates, along with government, agency, index, SOFR, and futures markets rates, plus economic statistics. |
| FIT | Fixed Income Trading | Fixed income electronic trading platform for U.S. rates and a broad set of global sovereign debt. |
| WB | World Bond Markets | Monitor and chart sovereign bond yields, spreads, and historical performance on one screen, along with current yields, spreads and current rates' statistical deviation from averages. |
| CDR | Markets Calendar | Shows when markets are open/closed and when they are operating on a partial day schedule. |
| MMR | Money Market/LIBOR Rates | Displays a menu of real-time global money market rate monitors for comparison against composite prices, third party prices, and electronic trading prices. |
| SRCH | Corp/Govt/Convert Bond Search | Create customized lists of loans, government and corporate bonds, structured notes, municipal bonds, and preferred securities from the Bloomberg database. |
| CRVF | All Yield Curves – Treas/Muni/Corp | Allows to search for curves, filtering by asset class, and country/region and/or sector. |
| PICK | Muni Offerings | Monitor U.S. municipal bond market offerings, bids wanted, and reported transactions in one place. |
Market performance shortcuts include:
| Shortcut | Description | Uses |
|---|---|---|
| BI | Bloomberg Intelligence | Sub-platform that provides research on industries, companies, and expert topics, delivering key data and interactive charting. |
| MOST | Most Active Securities | Displays different trading activity performance metrics of a specified security, such as Volume, Chg Up, Chg Down, Value, Delta AVAT, 52Wk Highs and 52Wk Lows. |
| FPC | Mutual Fund Ranked Returns | Allows comparing the returns and monitor the performance of a list of funds over a given period, and filtering by country, fund type, sector, and fund family name. |
| ECDR | IPO Calendar | Allows monitoring equity offerings by stage, region, industry, and other criteria. |
| PDF | Default Settings: Graphs, News, Messages | Allows configuring service default settings all in one screen, including country/region, primary and secondary exchanges, news sources, and other defaults. |
Bloomberg company screens include:
| Shortcut | Description | Uses |
|---|---|---|
| DES | Corporate Description | Consolidated financial information for a specific financial instrument, such as a bond, loan, swap, index, futures contract, stock, warrant, option, fund, money market program, currency, or preferred security. |
| MGMT | Executives & Board Directors | Displays company management information about top-ranking executives and board members for a selected security. |
| CN | Company News | Filtered view of the News (N) function for a loaded security. |
| ISSD | Financial Overview | Displays the issuer description in the Security Description (DES) function for bonds. |
| RELS | Related Securities | Provides a comprehensive overview of a security's issuer, including company description and fundamentals, debt obligations, equities, and related financial instruments. |
Fundamental and earnings research functions on Bloomberg are:
| Shortcut | Description | Uses |
|---|---|---|
| FA | Company Fundamentals | Provides comprehensive financial information for a company, including historical fundamental data and future estimates, as well as aggregated fundamental data for global equity indices. |
| DVD | Dividends, Stock splits | Displays the history of a company's distributions. History includes cash dividends and other distributions, such as stock splits. |
| ERN | Earnings Summary | Allows for comparison of historical announcements for the stock against consensus estimates. |
| EE | Earnings Estimates | Provides a snapshot of aggregated broker earnings projections, surprise earnings data, and a summary of earnings history. |
| GE | P/E Graph - Valuation | Filtered view of the Graph Fundamentals function (GF), allowing for visual comparison of a company's fundamentals with those of other companies, indices, commodities, and economic data. |
| EM | Estimates Matrix | Provides comprehensive earnings trend analysis for a selected equity, including an annual and quarterly breakdown of actual and estimated earnings trends. |
| ANR | Analyst Recommendations | Shows analysts recommendations for a selected equity and allows for monitoring of changes in opinion and analyzing the quality of analyst predictions. |
| PHDC | Institutional & Insider Holders | Menu that allows searching for holders whose trading activity may influence the price of a selected security. |
| CRPR | Credit Ratings | Allows for analysis of credit worthiness of a debt issuer or specific fixed income security by displaying both current and historical credit ratings from different ratings agencies in one screen. |
| CACS | Corporate Action Calendar | Displays a calendar of corporate and municipal actions for a single security, including events such as stock buybacks, capital changes, and distributions. |
| CF | Corp Filings – SEDAR/EDGAR | Provides access to publicly available filings for research purposes. |
Recent events:
| Shortcut | Description | Uses |
|---|---|---|
| GIP | Intraday Price Graph – up to 240 days | Visual time series analysis tool used to evaluate a security's intraday price trends for a period of up to 240 days. |
| QR | Time/Sales (Quote Recap) | QR displays a quote-by-quote and trade-by-trade history for a selected equity. |
| BQ | Customizable Company Overview | Povides detailed quotes, valuation and earnings ratios, peer activity, consensus forecasts, past performance trends, and related news headlines for an equity, equity option, or fund. |
| BAS | Broker Activity Summary | Provides broker activity summaries for exchanges, preferreds, equities, commodities, futures, warrants, REITs, funds, ETFs, and bonds. |
| AQR | Average Quote Recap | Displays the Top Trades in the Price and Volume Dashboard (VWAP) function. |
| VAP | Volume At Price | Displays the Volume at Price tab in the Price and Volume Dashboard (VWAP) function. |
| TSM | Trade Summary Matrix | Displays the Trade Summary Matrix tab in the Price and Volume Dashboard (VWAP) function. |
| OMON | Customizable Option Monitor | Provides real-time pricing, market data, and derived data for exchange-traded call and put options for a selected underlying security in a customizable screen. |
Powerful Bloomberg screens for fundamental research:
| Shortcut | Description | Uses |
|---|---|---|
| RV | Competitor Relative Value | Allows performing relative valuation analysis on a security against comparable companies or examining the relative richness/cheapness of a bond. |
| COMP | Comparative Total Return | Allows comparing of returns of a selected security for up to five other selected securities, including its benchmark index and industry group (if available). |
| TRA | Total Return for 1 Security | Allows for calculation of the total return for a security over a specified period of time, using criteria such as price at horizon, commissions, and reinvestment rate. |
| GP | Historical Graphs/Table | GP and its related charts (GPC, GPO, GPF, GPL) and study functions (RSI, MACD, BOLL) are visual time series analysis tools used to put financial data into context. |
| GPO | Bar Chart | Displays the open/high/low/close chart view of the Price Chart (GP) function. |
| HP | Historical Price Table | Displays a security's price, yield, and/or volume plus the close, open, high, and low prices. The historical price table shows pricing and volume data for a security over a specified period of time. |
| SI | Short Interest | Allows reviewing short interest information for equity securities that trade on certain exchanges. |
| G | Custom Technical Charts | Allows you to create and organize all of your custom charts. |
For analyzing an index or indices:
| Shortcut | Description | Uses |
|---|---|---|
| TRAY | Total Return | Displays the simple, annualized, and semi-annualized price appreciation of an index for 20 different time periods. |
| MOV | Index Movers | Allows analysis of the stocks that drive the movement of a selected index or other equity group. |
| MRR | Member Returns | Ranks the members of an equity index, basket, or portfolio by price appreciation or total return. |
| MEMB | Member Weights | Displays the members of an index and its current weightings, along with shares and price performance. |
Click the button below to download CFI’s free Bloomberg Functions Spreadsheet!
In addition to using Bloomberg functions on the Terminal, analysts must also be good at integrating Bloomberg into Excel.
Analysts will often build custom formulas that pull data directly from the Terminal to their desktop, where it can be integrated into financial analysis, financial modeling, and valuation work.
Below is a screenshot of the Bloomberg Terminal.
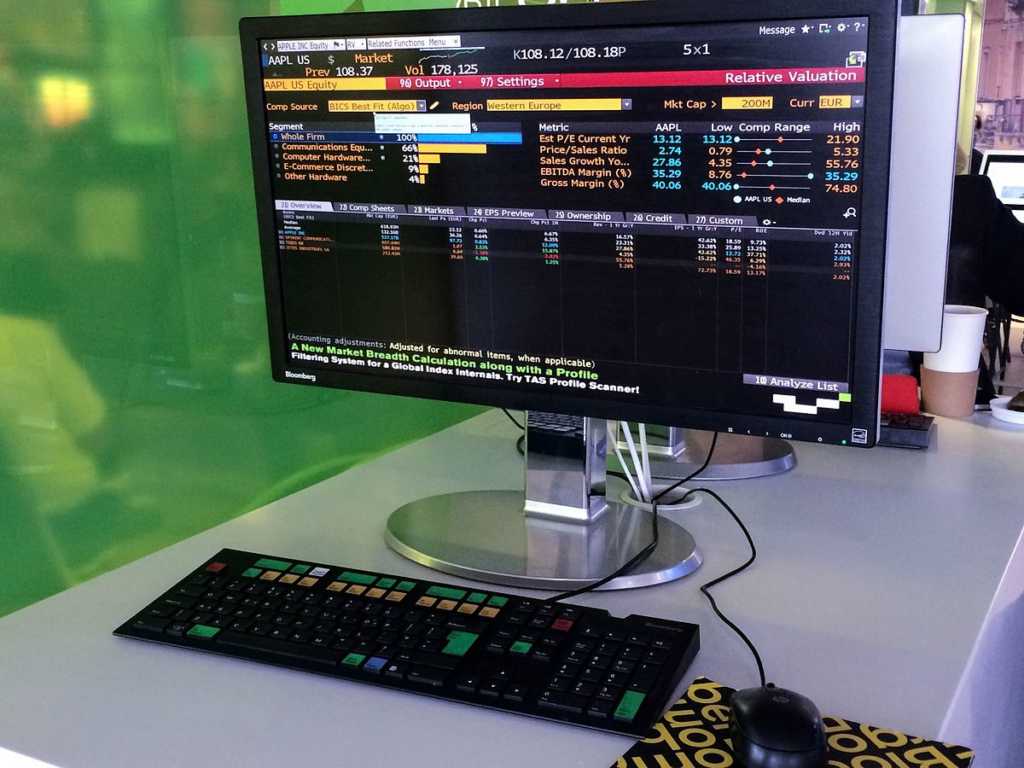
Analysts are expected to be efficient at using the Terminal and need to be able to quickly pull information.
The most common professions to use this data provider are investment banking, equity research, and sales & trading.
Connect what you just learned to a clear career path with CFI’s role‑based courses and certification programs.
Thank you for reading CFI’s guide on the Bloomberg Functions List. To keep learning and developing your knowledge of financial analysis, we highly recommend the additional CFI resources below:


