Get Certified for
Capital Markets (CMSA®)
From equities and fixed income to derivatives, the CMSA certification bridges the gap from where you are now to where you want to be — a world-class capital markets analyst.
An indication that the prevailing trend may reverse in the short or long term
Common in financial trading, the double top is a type of chart pattern that can be found when performing technical analysis. The double top chart pattern is an indication that the prevailing trend may reverse in the short or long term. Financial trading markets include the trading of currencies, stocks, commodities, and other financial assets.

The double top is a common occurrence towards the end of a bullish market. The price formation looks like two peaks that occur after one another. The peaks are generally the same price on a price-vs-time chart. The peaks include a separation or parting, which is the minimum price.
The parting or separation is also known as a valley. The price level at the valley is known as a neckline of the price formation. In the instance where the price drops below the neckline, the price formation is considered to be confirmed and complete. It serves as an indicator that the price is likely to continue to fall or that a continued price drop is looming.
The double top pattern tells an investor, trader, or analyst that the buyers in the market are prevailing, and as such, the demand is overtaking the supply up until the formation of the first top. It causes prices to rise. The trend is then reversed, and the sellers in the market begin to prevail, subsequently with the supply overtaking the demand. As the supply surpasses demand, the prices begin to fall. It creates the neckline or the price valley. Following the valley, the bulls or buyers in the market begin to dominate again, and prices begin to rise.
When the traders notice that the prices are not rising beyond the level reached by the first top, the bears or sellers may then begin to dominate and begin to lower price levels. It causes the formation of a double top. Should the prices drop beyond the valley, it is generally a bearish signal.
Two factors that allow analysts or traders to determine the existence of the double-top pattern are volume and the time between the peaks. When looking at the volume, it is beneficial to note that the buildup of the price level reached on the first peak can be attributed to increased volume. The fall to the neckline occurring thereafter can be attributed to low volumes. The second attempt leading towards the second peak should also be on low volume levels.
When looking at the time between the two tops to determine whether or not a double top pattern is present, it is beneficial to note that when the peaks reach the same price levels in very close time periods, they are to indicate that the trend will resume and that they form part of the consolidation.
As with all other chart patterns, the double top pattern is not to be used on its own. Although the formation may provide an overview of what is happening between the bulls and the bears, analysts and traders need to be precautious when identifying the price formation and ensuring its legitimacy before making a trade.
The double bottom formation typically occurs at the end of a downward trending or declining market. The double bottom is similar to the double top, but the key difference between the two can be seen in the inverse or negative relationship in price.
In contrast to the double top, the double bottom price formation comprises two peaks or prices occurring at a similar minimum level and are separated by a peak known as the neckline. When prices rise above the neckline, it serves as a confirmation of the price formation and may signal that prices will likely continue to rise.
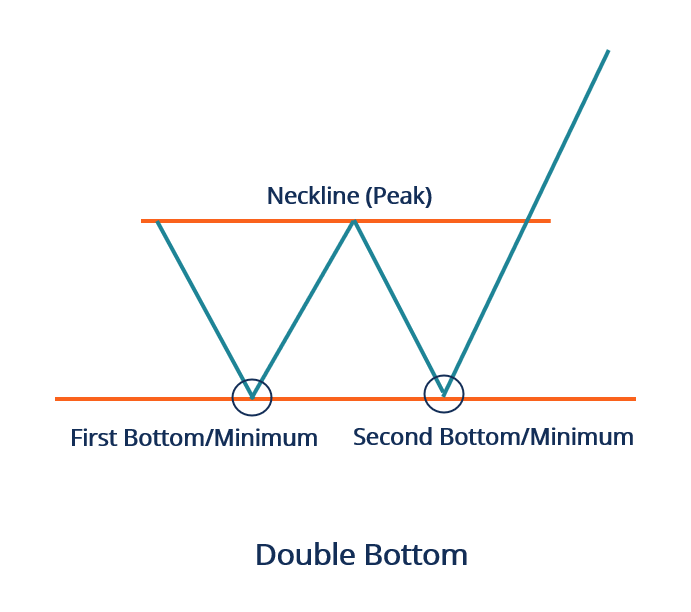
As with the double top, timing and volume also play a role in the analysis and confirmation of the double bottom.
CFI is the official provider of the global Capital Markets & Securities Analyst (CMSA®) certification program, designed to help anyone become a world-class financial analyst. To keep advancing your career, the additional resources below will be useful:


