Get Certified for
Capital Markets (CMSA®)
From equities and fixed income to derivatives, the CMSA certification bridges the gap from where you are now to where you want to be — a world-class capital markets analyst.
"The markets move in wave-like patterns driven by investor sentiment"
The Elliott Wave Theory is a technical analysis technique developed by American accountant and author Ralph Nelson Elliott in the 1930s. Elliott studied several years of stock market data across various indices and was the first to predict a stock market bottom in 1935.
Since then, the theory’s become a reliable tool for various portfolio managers across the world. Elliott waves are used with other technical analysis techniques to predict market movements and trading opportunities.
The Elliott Wave Theory suggests that stock price movements can be reasonably predicted by studying price history as the markets move in wave-like patterns driven by investor sentiment. Like ocean waves, the movements are repetitive, rhythmic, and timely. Moreover, the wave patterns are not seen as certain to occur in the markets; they only provide a probable scenario of stock price behavior.
Elliott’s Wave Theory mainly comprises two kinds of waves – motive (impulse waves) and corrective waves. Impulse or motive waves are movements that occur in the direction of a trend. On the other hand, corrective waves occur in a direction opposite to the ongoing trend. The diagram below clearly illustrates the movements of Elliott waves.
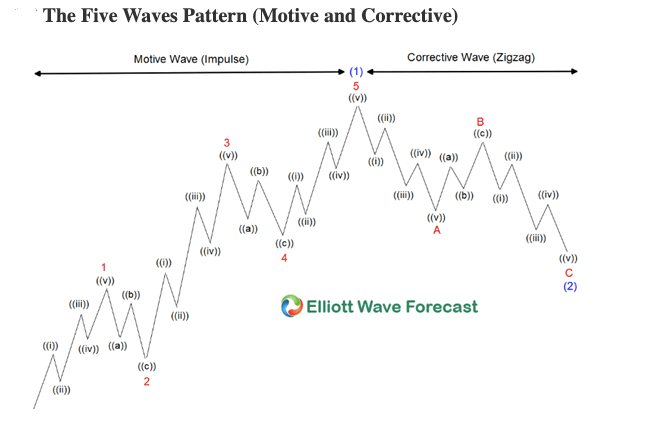
Let’s assume that we are in a bull market. In other words, one motive wave is driving the stock price up. One motive wave comprises five waves – 1, 2, 3, 4, and 5. Waves 1, 3, and 5 are impulsive in nature as they move the stock price in a particular direction (here, upwards, but even downward stock movement can constitute an impulse wave). Wave 2 is a smaller downward movement after wave 1, and wave 4 is a smaller downward movement after wave 3. The smaller downward movements after impulse waves are called retracement waves.
Furthermore, impulse waves (1, 3, and 5) are each divided into five waves. On observation, one can notice that waves 1, 3, and 5 comprise smaller upward and downward movements that, upon counting, amount to five waves. The movements are identified as ((i)), ((ii)), ((iii)), ((iv)), and ((v)).
On the other hand, retrace waves (2 and 4) are broken up into upward and downward movements of three waves, represented by ((a)), ((b)), and ((c)).
Put together, waves 1, 2, 3, 4, and 5 make up a single motive wave.
A corrective wave will take the stock price down. The correction occurs in three waves – A, B, and C. Waves A and C are made up of five waves characterized by ((i)), ((ii)), ((iii)), ((iv)), and ((v)). On the other hand, Wave B is made up of three waves identified by ((a)), ((b)), and ((c)).
In a bull market, a motive wave takes the stock price upwards, while a corrective wave reverses the trend. But, in a bear market, a motive wave would take the stock price down, and a corrective wave would take the stock price up. Therefore, in a bear market, the Elliott waves diagram shown above will be inverted. It will consist of five waves (1, 2, 3, 4, and 5) taking the price down and three waves (A, B, and C) taking the price up.
Some general guidelines can be followed to identify a motive wave:
In real-time markets, it was observed that a motive wave could comprise three waves instead of five. In fact, most of the time, the market will see a motive wave that is composed of three waves. It is also possible that the market keeps moving in corrective waves. Therefore, three-wave trends are more common than five-wave trends.
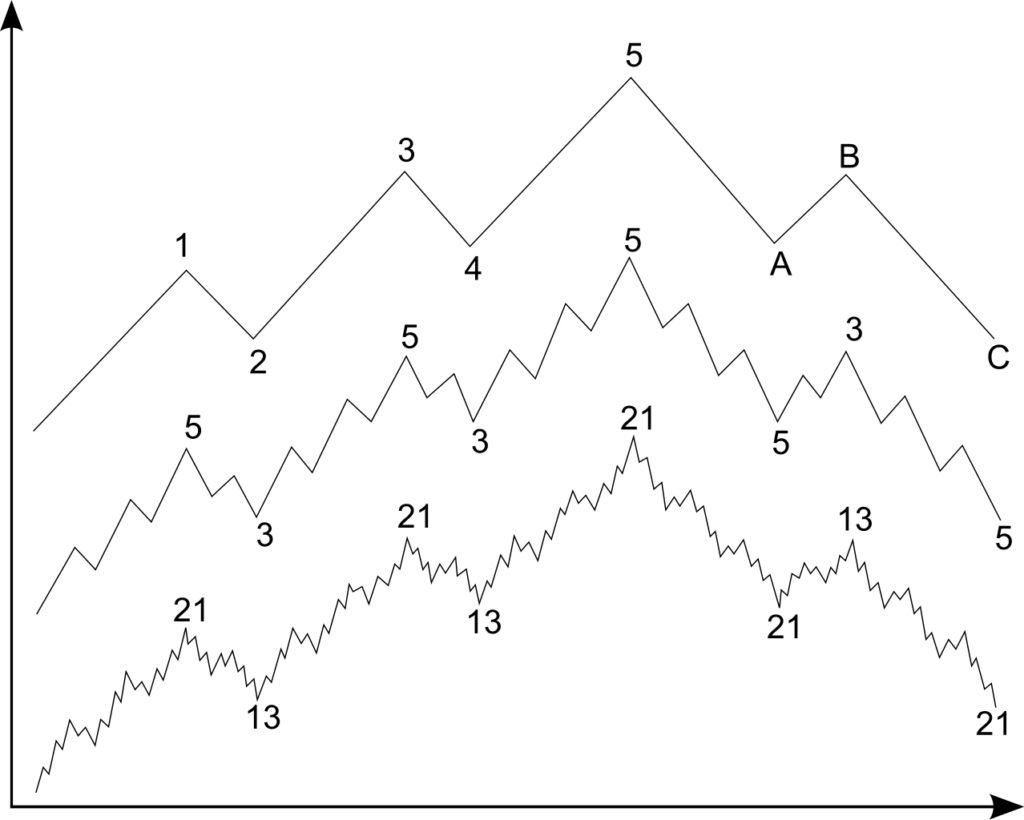
The Fibonacci summation series starts with 0 as the first term. The next number is obtained by adding 1 to 0. Then, the series is derived by adding the previous two numbers to obtain the next number. The Fibonacci summation series looks like 0, 1, 1, 2, 3, 5, 8, 13, 21, 34, to infinity. Fibonacci ratios are derived by dividing two Fibonacci numbers. The ratios are used to determine levels of support and resistance in the markets.
In Elliott Wave Theory, Fibonacci retracement is the use of Fibonacci ratios to determine where a correction ends so that the primary trend can begin again. Fibonacci retracements measure the depth of pullbacks in a trend. For example, Wave 2 can be 50% of the length of Wave 1.
Another widely used tool is Fibonacci extensions. Fibonacci extensions are used to determine the turning points in a primary trend. In a bull market, they indicate where a motive wave can go before a correction. In a bear market, they can be used to determine support levels. Fibonacci extensions are used to measure stock price levels at which profits can be realized.
Connect what you just learned to a clear career path with CFI’s role‑based courses and certification programs.
CFI offers the Capital Markets & Securities Analyst (CMSA)® certification program for those looking to take their careers to the next level. To keep learning and developing your knowledge base, please explore the additional relevant resources below:


