Get Certified for
Capital Markets (CMSA®)
From equities and fixed income to derivatives, the CMSA certification bridges the gap from where you are now to where you want to be — a world-class capital markets analyst.
A technical indicator used to determine the direction of the movement of an asset
The Parabolic SAR is a technical indicator developed by J. Welles Wilder to determine the direction that an asset is moving. The indicator is also referred to as a stop and reverse system, which is abbreviated as SAR. It aims to identify potential reversals in the price movement of traded assets. It can also be used to provide entry and exit points.
The Parabolic SAR mainly works in trending markets. Wilder recommends traders should first establish the direction of the trend using the parabolic SAR and then use alternative indicators to measure the strength of the trend.
When graphically plotted on a chart, the Parabolic SAR indicator is displayed as a series of dots. If it appears below the current price, the parabolic SAR is interpreted as a bullish signal. When it is positioned above the current price, it is deemed to be a bearish signal. The signals are used to set stop losses and profit targets.
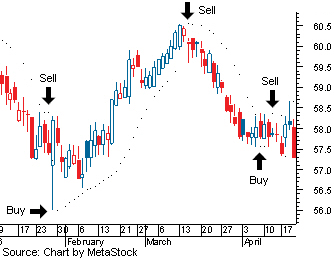
The Parabolic SAR is usually represented in the chart of an asset as a set of dots that are placed near the price bars. Generally, when these dots are located above the price, it signals a downward trend and it is deemed to be a sell signal. When the dots move below the price, it shows that the trend of the asset is upward and signals a buy.
The change in the direction of the dots produces trade signals which can produce a profit when the price makes big swings. However, the indicator is not as reliable in a flat or ranging marekt. The movements are demonstrated in the chart below:
When the price of a security rises, the dots also rise. The pace accelerates with the trend. The Parabolic SAR works well for capturing profits by entering the trade during a trend in a steady market.
It may produce false signals when the price moves sideways, and the trader should expect small losses or small profits. The indicator can also be used used to set stop loss orders. This can be achieved by moving the stop loss to match the level of the SAR indicator.
Wilder recommended using other indicators like the average directional index momentum indicator to confirm the strength of the existing trend. Other indicators that complement the SAR trading signals include moving averages and candlestick patterns.
For example, when the asset price falls below a long-term moving average, it confirms the sell signal that is produced by the Parabolic SAR. If the price is above the moving average, focus on taking the buy signals.
The Parabolic SAR uses the highest and lowest price as well as the acceleration factor to determine where the SAR indicator dot will be displayed. The formula for the Parabolic SAR is as follows:
Uptrend Parabolic SAR = Prior SAR + Prior AF (Prior EP – Prior SAR)
Downtrend Parabolic SAR = Prior SAR – Prior AF (Prior SAR – Prior EP)
Where:
Results obtained from the calculations above create a dot that is plotted against the asset price action, either below or above it. The dots help to determine the current direction of the price.
The benefit of using a Parabolic SAR is that it helps to determine the direction of price action. In a strong trending environment, the indicator produces good results. Also, when there is a move against the trend, the indicator gives an exit signal when a price reversal could occur. This tool works best in trending markets with long rallies or declines.
On the downside, the Parabolic SAR produces false signals when the price action starts moving sideways. Due to the lack of a trend, the indicator will move back and forth around the price bar, and this produces misleading signals. When a trader solely relies on the Parabolic SAR during sideways market conditions, it can result in losing trades.
To prevent such mishaps, traders should only trade in the direction of the dominant trend and avoid trades when a trend is absent. Also, using other indicators like moving averages alongside parabolic SAR can help prevent such losses.
Thank you for reading CFI’s guide on Parabolic SAR. To keep advancing your career, the additional resources below will be useful:


