Get Certified for
Business Intelligence (BIDA®)
Develop analytical superpowers by learning how to use programming and data analytics tools such as VBA, Python, Tableau, Power BI, Power Query, and more.
A technical analysis indicator that is used to support stock market prediction by comparing a security’s price range and closing price
The stochastic RSI (StochRSI) is a technical indicator used to measure the strength and weakness of the relative strength indicator (RSI) over a set period of time. StochRSI derives its values from the RSI. Basically, a stochastic oscillator is applied to a set of RSI values; Hence, it is based on price.
The stochastic formula is used to compare the stock’s closing price to its price range to predict price turning points. Through the formula, traders can identify whether the RSI values are overbought or oversold. The StochRSI oscillator comprises a more sensitive indicator adjusted to a specific historical performance, thanks to its use of both momentum indicators.
The StochRSI was first developed by trading system wizard Tushar Chande and money management expert Stanley Kroll in their 1994 book, “The New Technical Trader.” The idea was to increase sensitivity to give rise to overbought and oversold signals.
According to the technical traders, StochRSI oscillates between 20 and 80 for a long period without reaching an extreme range. Unlike in the traditional momentum indicators, where 70 and 30 indicate the turning points, the StochRSI uses 20 and 80 as the price overbought and oversold, respectively.
Traders might continuously find themselves on the sidelines if they are looking to enter the trade based on an oversold or overbought reading from RSI. Most traders now consider the StochRSI as an important momentum oscillator that is indispensable.
When interpreting raw historical data, the first issue of the proposed approach is performed to ensure the data is adaptable for further analysis. The formula for StochRSI is given by:
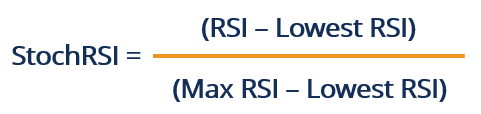
Where:
The StochRSI deduces its values from RSI readings. The RSI’s value input is 14, which provides the number of data periods included in the calculation. The RSI values are, in turn, incorporated in the StochRSI formula. The following step-by-step procedure illustrates how to come up with StochRSI.
An oversold market condition is indicated by the StochRSI value that is below 0.2. It means that the RSI reading is trading at the lower trading range, and a downward momentum may soon be exhausted for the impending upward turn to occur.
Conversely, a value of more than 0.8 implies an overbought market condition. The indication is that an impending downward turn may soon occur after an upward momentum is exhausted.
Other than identifying trading opportunities, the StochRSI can predict short-term trends. Traders define price reversals and price turns using an oscillator that moves with a defined range within a centerline of 0.5. Generally, the securities are trading higher when the StochRSI reading exceeds 0.5 during a trading range.
However, a value below 0.5 means that securities are trading lower. The Stochastic RSI can also be used alongside other technical indicators to provide price divergence signals and enhance effectiveness. Divergence offers insightful clues regarding the movement of the near-future momentum.
StochRSI tends to be more volatile. To control the downside, smoothing is necessary. It can be achieved using moving averages. The average price is plotted to represent each period on a graph, and the points connected form a flexible line that changes to coincide with the price bars.
In such a way, moving averages help smooth price fluctuations, so that market noise is reduced. Smoothing depends on the number of averaged periods to reveal the trend better.
Although the StochRSI and RSI utilize the same reversion concept, the latter relies on a different formula to compute RSI values. RSI derives its values from price, unlike StochRSI, which derives its values from itself.
One key feature that sets the two technical indicators apart is how fast they move. StochRSI’s movement is more rapid from overbought to oversold than that of RSI.
To keep learning and developing your knowledge of financial analysis, we highly recommend the additional resources below:


