Get Certified for
Capital Markets (CMSA®)
From equities and fixed income to derivatives, the CMSA certification bridges the gap from where you are now to where you want to be — a world-class capital markets analyst.
A stock market indicator that helps traders relate price and volume
The Volume Price Trend Indicator (VPT) is a stock market indicator that helps traders relate a stock’s price and trading volume. It helps in identifying the parity between the supply and demand for a stock and also helps in predicting the price of a stock, both in direction and magnitude.
The VPT is different from other price-volume indicators due to the fact that it takes into consideration the percentage increase or decrease in price and not just add or subtract the volume based on whether the current price is higher than the previous day’s price.
The idea behind the indicator is to multiply the market volume of a stock by the percentage change in its price. If the price of the stock declines, the value of the indicator falls. If the price increases, the value rises. The VPT is generally calculated on a daily basis, though it can be measured over any timeframe with which volume data is available.
The VPT is very similar to on-balance volume (OBV). In OBV, there is an increase or decrease in the indicator based on only price movements. The percentage move in price is not considered in the calculation. However, in VPT, the indicator moves based on the percentage shift in price.
When investors and traders look at the VPT, they are usually for divergences. A divergence is when the price of a stock moves in the opposite direction of an indicator. It usually suggests that there may be a change in the direction of the price.
For example, if volume remains constant, but there is an increase in price, it usually suggests that the price movement is weak, and there is a high chance of it being reversed. A trader who uses VPT and observes the fact, may not pursue long trades, expecting the market to go up further.
The interpretations of the VPT can be summed up as follows:
In technical analysis, the VPT is used mainly on longer-term frames due to its cumulative nature. It becomes difficult to use it on the short-term and intraday charts as the changes can be relatively small when compared to the actual VPT value. The problem persists with all volume-based indicators that use cumulative calculation.
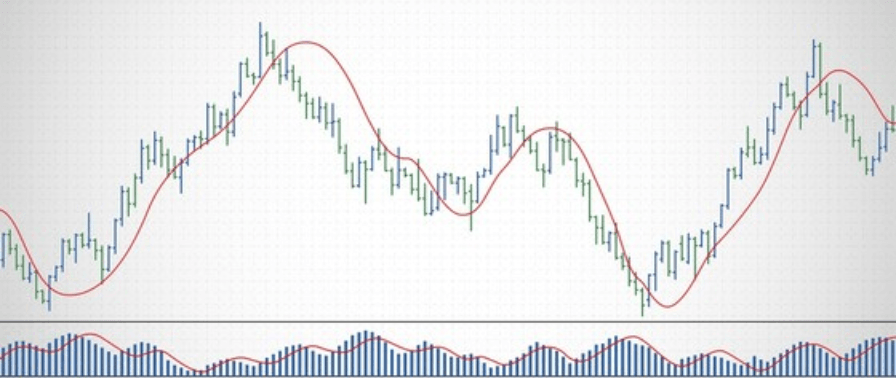
To simplify the analysis, it is recommended to use the VPT indicator along with a moving average applied to it as a signal line. When a moving average is used, VPT values below the line would suggest negative money flow and to sell, whereas VPT values above the line would suggest positive money flow and to buy.
The VPT can also be used with the average directional index (ADX) to confirm the market trend. The VPT is basically used in conjunction with the 25- to 50-day moving averages. If the moving averages and the VPT are moving in the same direction, then a trader may decide to buy and vice-versa.
Like all technical trading tools, VPT is best used in conjunction with other tools than on its own. Using an indicator independently to make trading decisions will be a form of misuse. The indicators are best used as guides for trading decisions rather than standalone systems.
CFI is the official provider of the Capital Markets & Securities Analyst (CMSA)® certification program, designed to transform anyone into a world-class financial analyst.
To keep learning and developing your knowledge of financial analysis, we highly recommend the additional resources below:


