Excel Dashboards
Use to display overviews of large data tracks
What are Excel Dashboards?
Excel dashboards make it easy to quickly review data reports rather than wade through large volumes of data. Overviews help make quick, urgent decisions by allowing one to skim through a lot of information at once in a short time.
The dashboards make it easy to track Key Performance Indicators (KPIs), helping organizations monitor progress toward their targets. They provide a high-level summary of key aspects of your data to keep everyone up to date on progress, thereby giving the organization a timely indicator for necessary action.
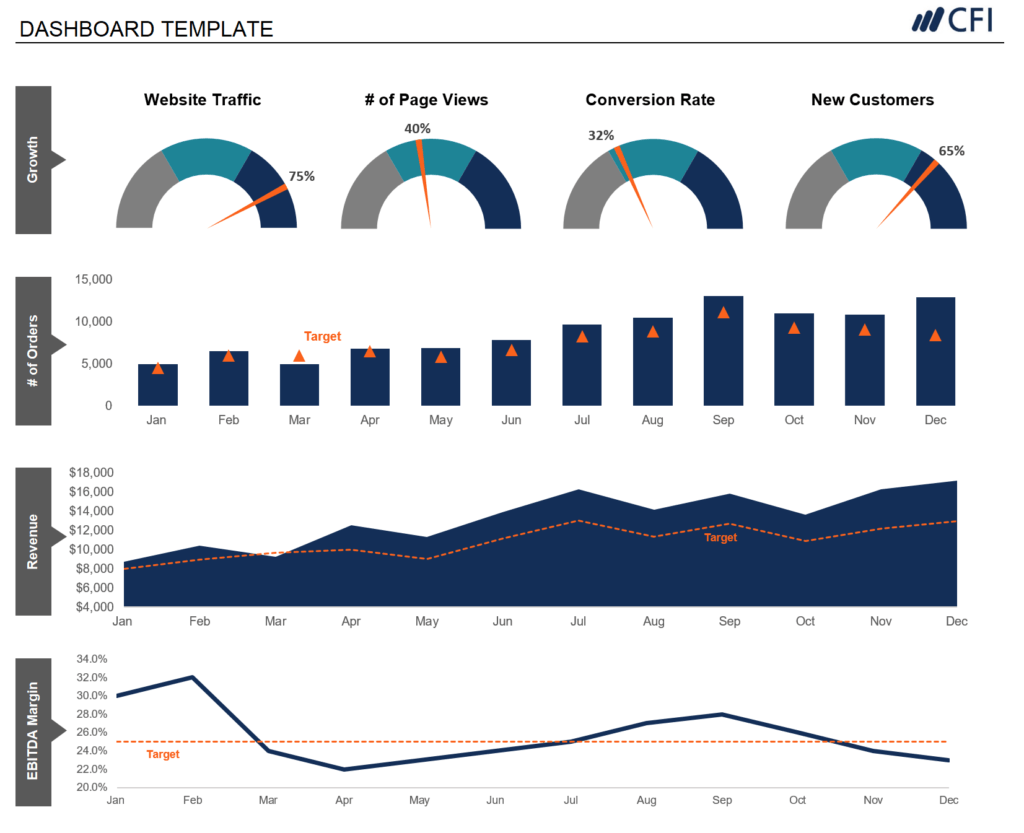
Excel dashboards include elements such as charts, tables, figures, and gauges that help present data. They can handle any type of data from different markets and purposes, and the information can be used for marketing, financial, or other business projects. The dashboard is most applicable to large volumes of data, as it would otherwise be hectic to go through them, especially with limited time. One can either build their own dashboard or use a template to start using Excel dashboards.
Key Highlights
- The Excel Dashboard is used to display overviews of large data tracks.
- Excel Dashboards use dashboard elements such as tables, charts, and gauges to provide overviews.
- The dashboards ease decision-making by presenting the key data in a single window.
How to Create an Excel Dashboard
The following outlines the initial steps in creating an Excel dashboard:
1. Brainstorm ideas and strategize on the dashboard’s main purpose
Before investing time and money in building Excel dashboards, users should first brainstorm the types of data to add to the dashboard. Strategize on the main purpose you want the dashboard to serve. Do you want to track specific business departments or the performance of a specific product produced by the company?
2. Identify the appropriate data source
After deciding on the purpose, the next step is to identify the appropriate data source to display on the dashboard. The data serves as the foundation of the dashboard and guides the components that will be added to it.
The purpose of creating the dashboard largely determines its appearance and features. The dashboard should focus only on the data necessary to support key decisions. Its appearance also depends on the recipients of the information. What are their preferences? Is the consumer a manager, an external client, or a colleague? How much time do they have to study the dashboard? All the attributes should be key to designing the dashboard while keeping the consumer’s preferences in mind.
How to Design an Excel Dashboard
The brainstorming stage will outline relevant dashboard elements to include in the design. You can decide to use or improve prebuilt templates to save time and money. The key elements of the template will include pivot tables, static tables, dynamic charts, auto-shape objects, gauge widgets, and other non-chart widgets.
The space occupied by each item also determines the appearance and readability of the dashboard. Are there too many small objects in the dashboard? Are the elements necessary, or do you need a few large objects that are easy and fast to study? Identify all the key elements you want to see on the dashboard so you can categorize similar elements in the same section.
In addition, the Excel dashboard’s background color significantly affects the readability of the data. You can color-code similar objects to make it easier for data users to read the information presented on the dashboard. The choice of colors also helps users distinguish between certain groups of elements for easier comparison. The Excel dashboard’s user interface can be enhanced by simplifying the navigation panels. One way to achieve it is to add labels to graphs, include drop-down lists, and freeze panels to limit scrolls.
How PowerPoint Eases Use of Excel Dashboards
Microsoft’s slideshow and presentation application, PowerPoint, can enhance the presentation of Excel dashboards by making them more interactive for users. Making the dashboard interactive using only Excel can be a complex process, as it would require using macros and VBA, which are advanced languages for working with Excel sheets. The simpler alternative is to add the interactive elements to PowerPoint, since it comes with built-in ones.
For example, you can add charts to PowerPoint and use the interactivity elements to simplify the presentation. If you are presenting the performance data for ABC Limited over 10 years, it will be difficult to present in Excel. When using PowerPoint, you can create 10 charts spanning 10 years, each showing the company’s performance for that year.
The charts can then be added to the Excel dashboard. Each chart can be placed on an individual slide, so that when navigating through the charts, the slides appear to move. It increases the interactivity and presentation of the ten-year performance data in Excel.
Connect what you just learned to a clear career path with CFI’s role‑based courses and certification programs.
Additional Resources
CFI offers the Financial Modeling & Valuation Analyst (FMVA)™ certification program for those looking to take their careers to the next level. To keep learning and developing your knowledge base, please explore the additional relevant resources below:
Excel Tutorial
To master the art of Excel, check out CFI’s Excel Crash Course, which teaches you how to become an Excel power user. Learn the most important formulas, functions, and shortcuts to become confident in your financial analysis.

Launch CFI’s Excel Crash Course now to take your career to the next level and move up the ladder!


