CONFIDENCE Function
Calculates the confidence interval for a population mean
What is the Excel Confidence Interval Function?
The CONFIDENCE Function[1] is categorized under Excel Statistical functions. It will use the normal distribution to calculate and return the confidence interval for a population mean. The confidence interval Excel formula can be extremely useful for financial analysis.
As a financial analyst, =CONFIDENCE() is helpful in predicting and adjusting for a wide range of financial goals by optimizing financial decision-making. It is done by applying and graphically mapping financial data into a distribution set of variables.
Analysts can make better financial decisions based on the statistical information provided by the normal distribution. For example, they can find the connection between income earned and income expended on luxury items.
Key Highlights
- A confidence interval, in statistics, represents the likelihood that a population parameter will lie within a specific range for a certain percentage of occurrences.
- Analysts commonly employ confidence intervals such as 95% or 99%.
- The CONFIDENCE Function can be used in financial analysis by helping apply and graphically map financial data into a distribution set of variables.
Confidence Interval Excel Formula
=CONFIDENCE(alpha,standard_dev,size)
The CONFIDENCE function uses the following arguments:
- Alpha (required argument) – This is the significance level used to compute the confidence level. The significance level is equal to 1– confidence level. So, a significance level of 0.05 is equal to a 95% confidence level.
- Standard_dev (required argument) – This is the standard deviation for the data range.
- Size (required argument) – This is the sample size.
To calculate the confidence interval for a population mean, the returned confidence value must then be added to and subtracted from the sample mean. For example, for the sample mean x:
Confidence Interval = x ± CONFIDENCE
How to use the Confidence Interval Excel formula?
To understand the uses of the function, let us consider an example:
Example – Confidence interval Excel
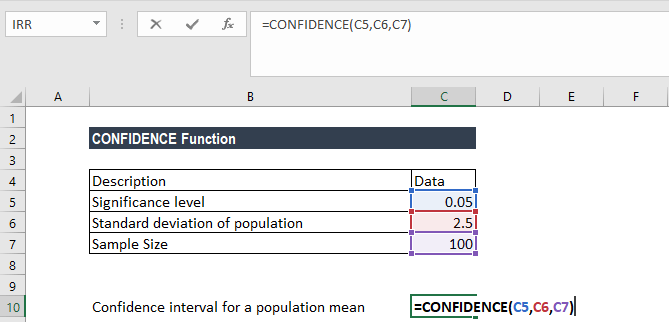
Suppose we are given the following data:
- Significance level: 0.05
- Standard deviation of the population: 2.5
- Sample size: 100
The confidence interval Excel function is used to calculate the confidence interval with a significance of 0.05 (i.e., a confidence level of 95%) for the mean of a sample time to commute to the office for 100 people. The sample mean is 30 minutes and the standard deviation is 2.5 minutes.
To find out the confidence interval for the population mean, we will use the following formula:
We get the result below:
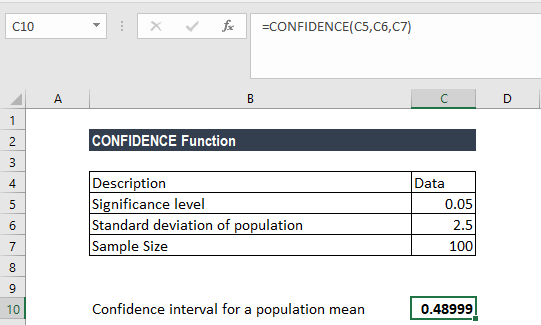
Therefore, the confidence interval is 30 ± 0.48999, which is equal to the range 29.510009 and 30.48999 (minutes).
Notes about the CONFIDENCE Function
- In Excel 2010, the CONFIDENCE function was replaced by the CONFIDENCE.NORM function. The former is still available in later versions of Excel for compatibility purposes.
- #NUM! error – Occurs if either:
- The given alpha is less than or equal to zero.
- The given standard deviation is less than or equal to zero.
- The size argument given is less than one.
- #VALUE! error – Occurs when any of the arguments provided is non-numeric.
Click here to download the sample Excel file
Additional Resources
Thanks for reading CFI’s guide to the confidence interval Excel function. By taking the time to learn and master these functions, you’ll significantly speed up your financial modeling. To learn more, check out these additional CFI resources:
- Excel Countif Not Blank Formula
- Advanced Excel Formulas You Must Know
- ISBLANK Function
- CONFIDENCE.T Function
- See all Excel resources
Article Sources
Excel Tutorial
To master the art of Excel, check out CFI’s Excel Crash Course, which teaches you how to become an Excel power user. Learn the most important formulas, functions, and shortcuts to become confident in your financial analysis.

Launch CFI’s Excel Crash Course now to take your career to the next level and move up the ladder!


