Excel remains a universally common tool for organizing, analyzing, and interpreting vast data sets. Finance professionals often work with complex data sets that include transactions, accounts, customer information, and financial statements. However, duplicate values can skew the data, leading to inaccurate analyses, reporting, and decision-making. Understanding how to highlight duplicate values in Excel is a critical skill for anyone working with large data sets.
The following tutorial provides detailed instructions to highlight duplicates in Excel.
Key Highlights
Duplicate values in Excel data can lead to misleading analyses, reporting, and decision making. Knowing how to highlight duplicates in Excel is a key skill for any finance professional or data analyst.
Conditional Formatting provides a quick and easy way to highlight duplicates in Excel within a selected range of data.
The COUNTIF function is another way to identify duplicates in Excel by returning a count of duplicate entries. It may be combined with Conditional Formatting to highlight duplicates.
Using Conditional Formatting to Highlight Duplicate Values in Excel
The most straightforward way to highlight duplicates in Excel is the built-in Conditional Formatting function. With Conditional Formatting, you can quickly highlight duplicates within your selected range of data.
Here’s a step-by-step guide using Conditional Formatting to highlight duplicates in Excel.
1. Select Your Data Range: Open your Excel spreadsheet and select the range of cells you want to check for duplicate values. Duplicate data can be found in a few cells, a single row or column, multiple rows or columns, or even the entire sheet.
2. Go to the Home Tab: On the Excel ribbon, find the ‘Home’ tab and click on it to see various options.
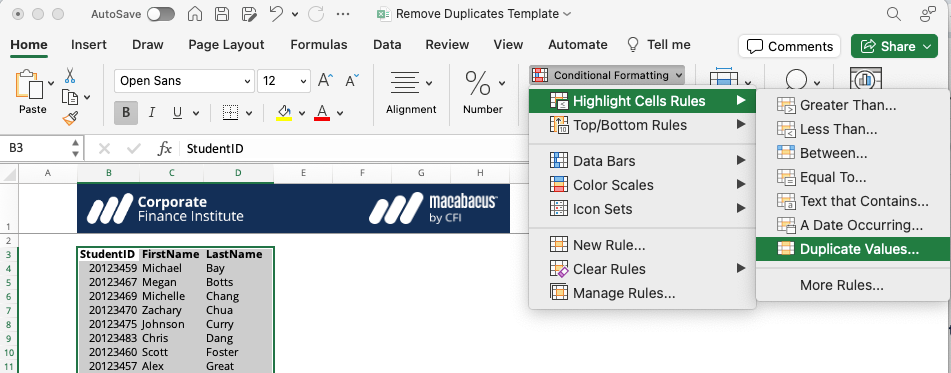
3. Conditional Formatting: In the ‘Styles’ group within the ‘Home’ tab, look for the ‘Conditional Formatting’ button and click on it.
4. Highlight Cells Rules: From the ‘Conditional Formatting’ dropdown menu, select ‘Highlight Cells Rules’. This will open another submenu.
5. Select ‘Duplicate Values’: In the submenu, click on ‘Duplicate Values’. A dialog box will appear.
6. Choose Your Highlighting Options: In the dialog box, you can choose how you want to highlight duplicates. Excel usually offers a few formatting options, such as changing the cell color. After selecting your preferred formatting style, click ‘OK’.
Excel will automatically highlight duplicate values in the range you selected, based on the formatting options you chose. In the illustration below, duplicate rows are highlighted in a light red fill with text in dark red. Highlighting duplicate values makes it easier to find and remove duplicates in your data set.
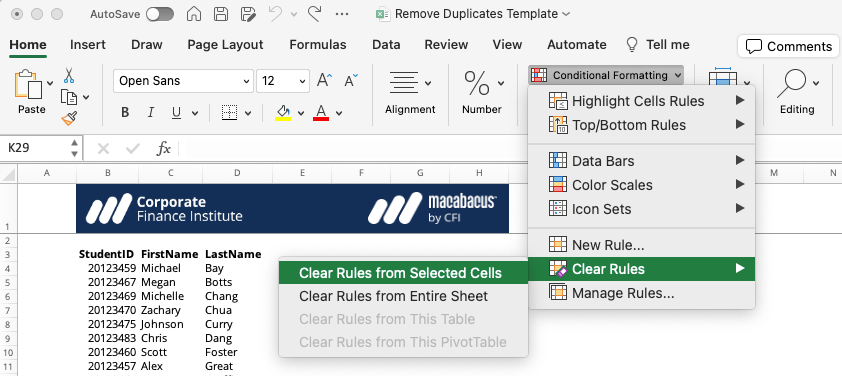
7. Remove Conditional Formatting: To remove the Conditional Formatting, select Home -> Conditional Formatting -> Clear Rules.
Keyboard Shortcut to Highlight Duplicates in Excel
Excel shortcuts reduce the time required for common tasks. Use the following keyboard shortcut to highlight duplicate entries in Excel.
Press each key separately, not all at once.
ALT -> H -> L -> H -> D
Using the COUNTIF Function to Find Duplicates in Excel
The built-in COUNTIF function provides another way to identify duplicates in Excel, offering flexibility and precision, especially in data sets where you need to consider multiple conditions. By specifying a range and criteria, you can create a formula-based rule that returns the count of duplicate entries.
Highlighting Duplicate Values with the COUNTIF Function
Using the Excel COUNTIF function with Conditional Formatting is another way to highlight duplicates in your data set. With this method, you will create a rule-based formula to highlight duplicates.
1. Select Your Data Range: Click and drag to select the range of cells you want to check for duplicates. For example, if your data is in column A from A2 to A100, select this range.
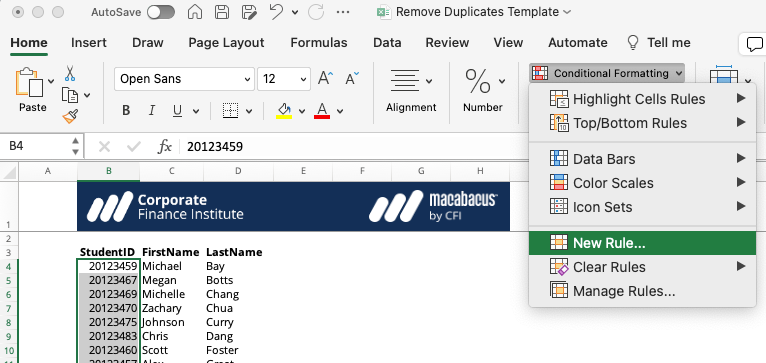
2. Access Conditional Formatting: Go to the Home tab on the ribbon, find the Styles group, and click on Conditional Formatting.
3. Choose ‘New Rule’: From the dropdown menu, select New Rule to open the New Formatting Rule dialog box.
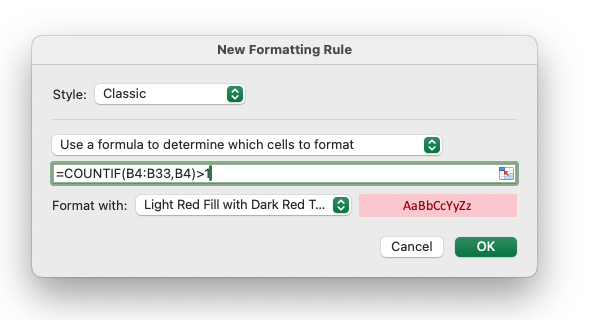
4. Select Rule Type: Choose Use a formula to determine which cells to format. This option allows you to input a custom formula—this is where COUNTIF comes into play.
5. Enter the COUNTIF Formula: In the formula box, enter the COUNTIF formula designed to identify duplicates. For example, if your data is in B4:B33, you would use =COUNTIF(B4:B33,B4)>1. This formula counts how many times the value in the current cell (starting at B4) appears in the range from B4 to B33. If a value appears more than once, it is considered a duplicate, and the condition >1 becomes true.
6. Set Formatting Options: Click the Format… button to specify how you want Excel to highlight the duplicates (e.g., by changing the cell fill color). After selecting your preferred formatting, click OK.
7. Apply the Rule: Click OK to apply the new formatting rule. Excel will then highlight the cells in your specified range that meet the duplicate criterion.
8. Finalizing: Click OK again in the Conditional Formatting Rules Manager (if shown) to close it and return to your sheet.
Other Options to Find Duplicate Values
Beyond highlighting duplicates, Excel provides additional functionalities to find duplicate values, such as the ‘Remove Duplicates’ feature under the ‘Data’ tab, which allows for the direct deletion of duplicate entries.
Using the ‘Remove Duplicates’ Feature
1. Select Your Data: First, highlight the range of cells, or select the entire table or sheet, where you suspect duplicate entries might exist. If your data includes headers (which is often the case), make sure to include them in your selection.
2. Navigate to the Data Tab: On the Excel ribbon, click on the ‘Data’ tab to view the options available for data management.
3. Find and Click ‘Remove Duplicates’: Within the ‘Data Tools’ group, you’ll find the ‘Remove Duplicates’ button. Clicking this button will open a dialog box that offers further customization for removing duplicate entries.
Key Takeaways
The ability to highlight duplicates in Excel is a critical skill to help you ensure data accuracy and integrity. With Excel functions like Conditional Formatting, the COUNTIF formula, and Remove Duplicates, users can efficiently find, highlight, and eliminate duplicates, leading to more accurate data analyses and informed decision-making. Embracing these practices will undeniably enhance your Excel data management capabilities.
To master the art of Excel, check out CFI’s Excel Crash Course, which teaches you how to become an Excel power user. Learn the most important formulas, functions, and shortcuts to become confident in your financial analysis.
Take your learning and productivity to the next level with our Premium Templates.
Upgrading to a paid membership gives you access to our extensive collection of plug-and-play Templates designed to power your performance—as well as CFI's full course catalog and accredited Certification Programs.
Gain unlimited access to more than 250 productivity Templates, CFI's full course catalog and accredited Certification Programs, hundreds of resources, expert reviews and support, the chance to work with real-world finance and research tools, and more.