How to Add a Secondary Axis in Excel

A step-by-step guide

Over 2 million + professionals use CFI to learn accounting, financial analysis, modeling and more. Unlock the essentials of corporate finance with our free resources and get an exclusive sneak peek at the first module of each course. Start Free

How to Add a Secondary Axis in Excel?

The article below provides a step-by-step guide on how to add a secondary axis[1] to charts in Microsoft Excel. A secondary vertical axis gives us more versatility with regards to data visualization and also provides us with the ability to plot multiple data series on the same chart.

A secondary axis allows us to represent and visualize multiple data series without the need to use additional charts. The feature is especially useful when we want to compare data series that are measured in different units or with different scales of comparison. For example, it is impossible to compare aggregate GDP with the unemployment rate using the same scale. We can either standardize the data, i.e., use an index for the data, or use a secondary axis.

Examples of Chart with a Secondary Axis

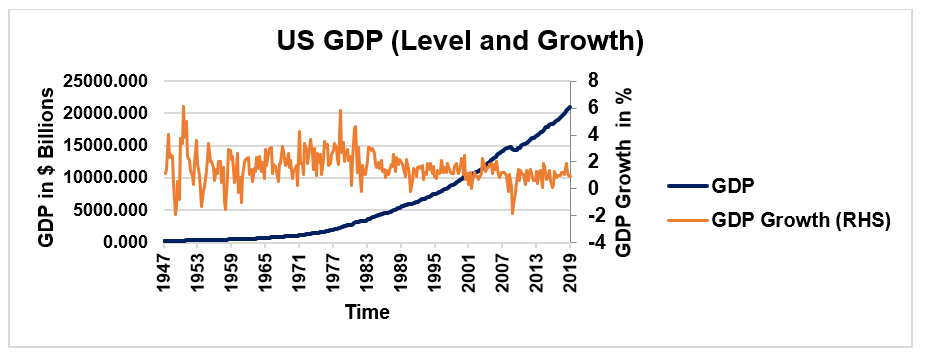
The chart below is made from US quarterly GDP data. The left-hand side vertical axis measures the GDP in levels, whereas the right-hand side vertical axis measures the growth in GDP. The next section will provide a step-by-step guide on how to recreate the exact chart.

Secondary Axis in Excel

Adding a Secondary Axis in Excel – Step-by-Step Guide

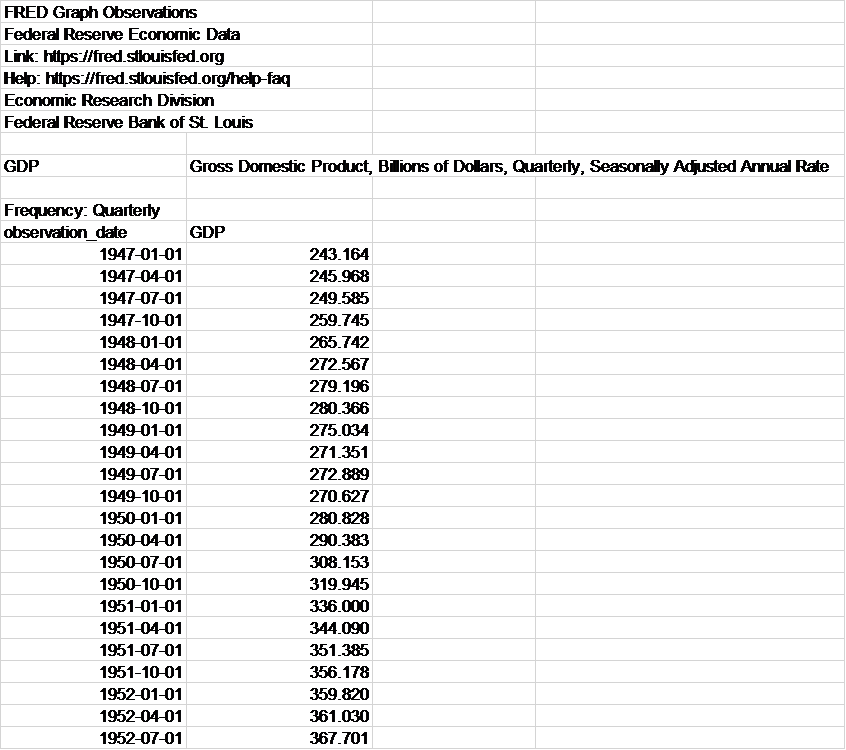
1. Download the sample US quarterly GDP data here.

Secondary Axis in Excel - Sample US Quarterly GDP Data Part 1

….

Secondary Axis in Excel - Sample US Quarterly GDP Data Part 2

2. Open the file in Excel, and get the quarterly GDP growth by dividing the first difference of quarterly GDP with the previous quarter’s GDP.

GDP Comparison Table

3. Select the GDP column (second column) and create a line chart. Use the quarterly observation date column (first column) as the horizontal axis, i.e., the axis label for the GDP. Change the format of the axis labels to show year only. It can be done by changing the number format in the right-hand side formatting pane to yyyy.

Create Chart

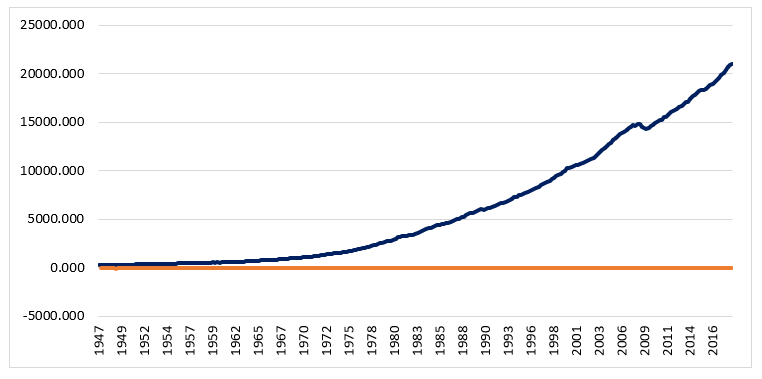
4. Add the GDP growth column (fourth column) to the chart by right-clicking on the chart and clicking on select data and then adding a new data series. Use the quarterly observation date column (first column) as the horizontal axis, i.e., as the axis labels for the GDP growth. The chart should look like the one below:

New Data Series

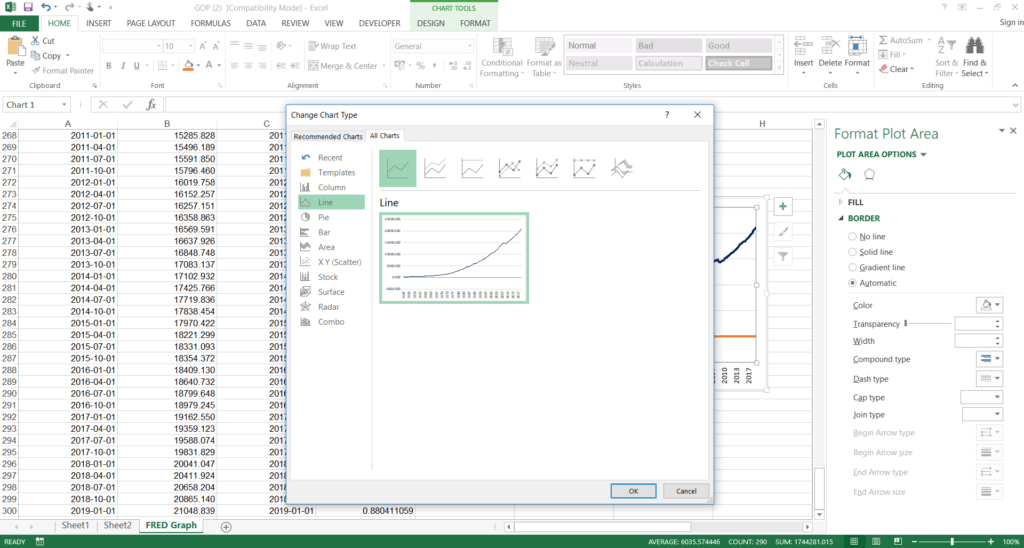
5. Right-click on the chart and choose “Change Chart Type.” The following menu should appear:

Change Chart Type

6. From the menu, select Combo and set both the chart types to “line” and set the GDP growth data series to the secondary axis.

Set the GDP Growth Data Series

7. The chart should look like the one below:

Sample Chart

8. The last step is to make cosmetic changes that make the chart easier to work with. The changes that can be made include adding axis labels, a legend, and a chart title.

Chart with Title, Legend, and Labels

Additional Resources

CFI is the official provider of the Financial Modeling and Valuation Analyst (FMVA)™ certification program, designed to transform anyone into a world-class financial analyst.

To keep learning and developing your knowledge of financial analysis, we highly recommend the additional resources below:

Article Sources

  1. How to Add a Secondary Axis in Excel

Additional Resources

CFI is a global provider of financial modeling courses and of the FMVA Certification. CFI’s mission is to help all professionals improve their technical skills. If you are a student or looking for a career change, the CFI website has many free resources to help you jumpstart your Career in Finance. If you are seeking to improve your technical skills, check out some of our most popular courses. Below are some additional resources for you to further explore:

The Financial Modeling Certification

Analyst Certification FMVA® Program

CFI is a global provider of financial modeling courses and of the FMVA Certification. CFI’s mission is to help all professionals improve their technical skills. If you are a student or looking for a career change, the CFI website has many free resources to help you jumpstart your Career in Finance. If you are seeking to improve your technical skills, check out some of our most popular courses. Below are some additional resources for you to further explore:

The Financial Modeling Certification

Below is a break down of subject weightings in the FMVA® financial analyst program. As you can see there is a heavy focus on financial modeling, finance, Excel, business valuation, budgeting/forecasting, PowerPoint presentations, accounting and business strategy.


Financial Analyst certification curriculum


A well rounded financial analyst possesses all of the above skills!


Additional Questions & Answers

CFI is the global institution behind the financial modeling and valuation analyst FMVA® Designation. CFI is on a mission to enable anyone to be a great financial analyst and have a great career path. In order to help you advance your career, CFI has compiled many resources to assist you along the path.

In order to become a great financial analyst, here are some more questions and answers for you to discover:


Excel Tutorial

CFI is a global provider of financial modeling courses and of the FMVA Certification. CFI’s mission is to help all professionals improve their technical skills. If you are a student or looking for a career change, the CFI website has many free resources to help you jumpstart your Career in Finance. If you are seeking to improve your technical skills, check out some of our most popular courses. Below are some additional resources for you to further explore:

The Financial Modeling Certification

Launch CFI’s Excel Course now

to take your career to the next level and move up the ladder!

0 search results for ‘