Get Certified for Financial Modeling (FMVA)®
Gain in-demand industry knowledge and hands-on practice that will help you stand out from the competition and become a world-class financial analyst.
Key inputs and activities that drive a business's operational and financial results
Business drivers are the key inputs and activities that drive the operational and financial results of a business. Common examples of business drivers are salespeople, number of stores, website traffic, number and price of products sold, units of production, etc. In order to make internal choices about business strategy or build a financial model to value a company, it’s critical to gain a solid understanding of the main drivers of a business.
Drivers vary significantly by industry, but they can all be determined using the same type of root cause analysis.
Here is a list of common business drivers:
Drivers impact all financial aspects of a business: revenues, expenses, and capital costs. In identifying what the main drivers are, it’s important to do a root cause type of analysis.
Start by looking at the company’s financial statements, and ask the question, “What drives this line item?”
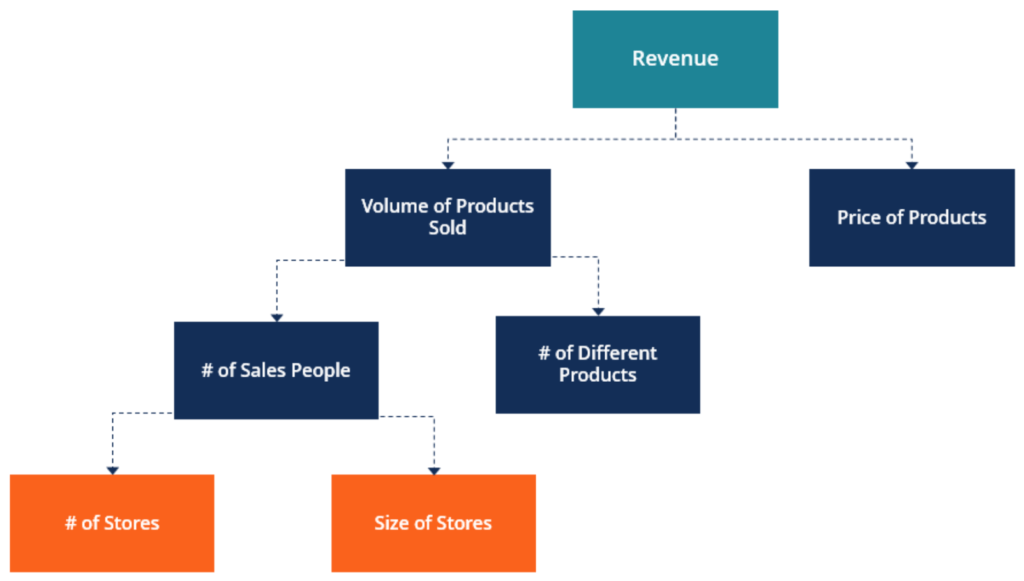
Let’s take revenue as an example.
Q: For a company in brick and mortar retail (e.g., a yoga clothing company), what drives revenue?
A: Volume of products sold, multiplied by the average price
Q: What drives volume?
A: The number of products and the number of salespeople
Q: What drives the number of salespeople?
A: The number of stores and the sizes of the stores
Q: What drives the number of stores?
A: This is a core business driver. It’s an operational and capital decision to open more stores or not, so there’s nothing that precedes it.
Number of stores is one of the key business drivers for this business.
This process should be repeated for each line-item on each of the three financial statements. Once completed, take the list of drivers and determine which are the most important to focus on. These will be the ones that impact the main areas of the business and have the largest effect on results.
Once the most important business drivers have been identified (using the process above), it’s important to monitor the results of the business and make strategic decisions to improve performance in the future.
Continuing with the example above, now that number of stores has been identified as a key business driver, it is important to track that metric, along with the size of each store, the number of salespeople per store, the volume and price of products per store, and, finally, the revenue.
By tracking all these figures, it will be possible to monitor how effective a strategy of adding new stores is, relative to other drivers such as adding salespeople, raising prices, or carrying a wider range of inventory.
For any professional working in financial planning and analysis (FP&A), a big part of the job will be reporting on key business drivers with charts, graphs, and tables.
Once the data has been collected, the job of the financial analyst is to present it in a way that’s easy to understand. A popular method is to create a dashboard that summarizes the key metrics and that helps executives and key decision-makers visualize what’s happening in the business.
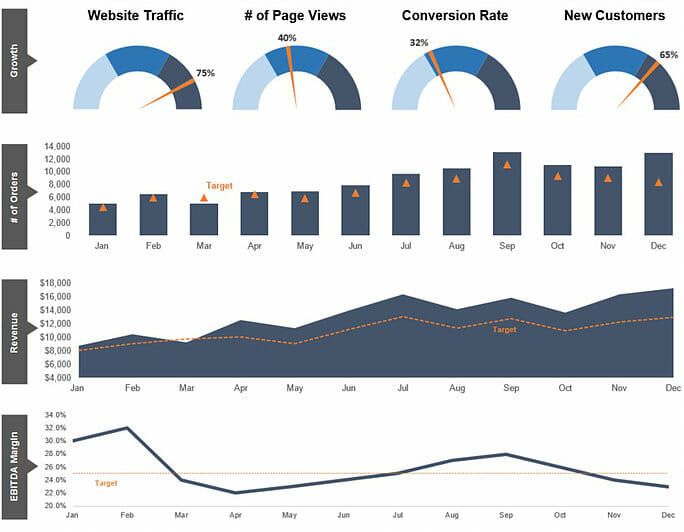
The above screenshot is from CFI’s Dashboards and Data Visualization course, which teaches you how to make a dashboard from scratch.
When building a financial model in Excel, the process begins with building an assumptions section, which includes all the main business drivers. Once these inputs are all in place, a forecast can be built, and a basic three-statement model can be created.
After the three-statement model is linked up, a discounted cash flow DCF model can be built to value the business. Advanced modeling, such as sensitivity analysis, financing structures, and transactions (e.g., mergers and acquisitions, or M&A), can also be conducted.
To learn more, check out CFI’s financial modeling courses.
Thank you for reading this guide to business drivers and understanding their importance in business decision making and strategy. To continue learning and developing your skills, these additional free CFI resources will be helpful:


