Over 2 million + professionals use CFI to learn accounting, financial analysis, modeling and more. Unlock the essentials of corporate finance with our free resources and get an exclusive sneak peek at the first module of each course.
Start Free
What is a Capital Investment Model?
Most companies make long-term investments that require a large amount of capital invested in the initial years, mostly in fixed assets such as property, machinery, or equipment. Due to the significant amount of cash outflows required, companies perform a capital investment analysis to evaluate the profitability of an investment and determine whether it is worthy. This is especially important when a business is presented with multiple potential opportunities and needs to make an investment decision based on the long-run returns they can get.
In this guide, we will outline the major line items that should be included in a capital investment model and how to use the calculated metrics to evaluate the investment.
#1 Revenues, Expenses and Profit
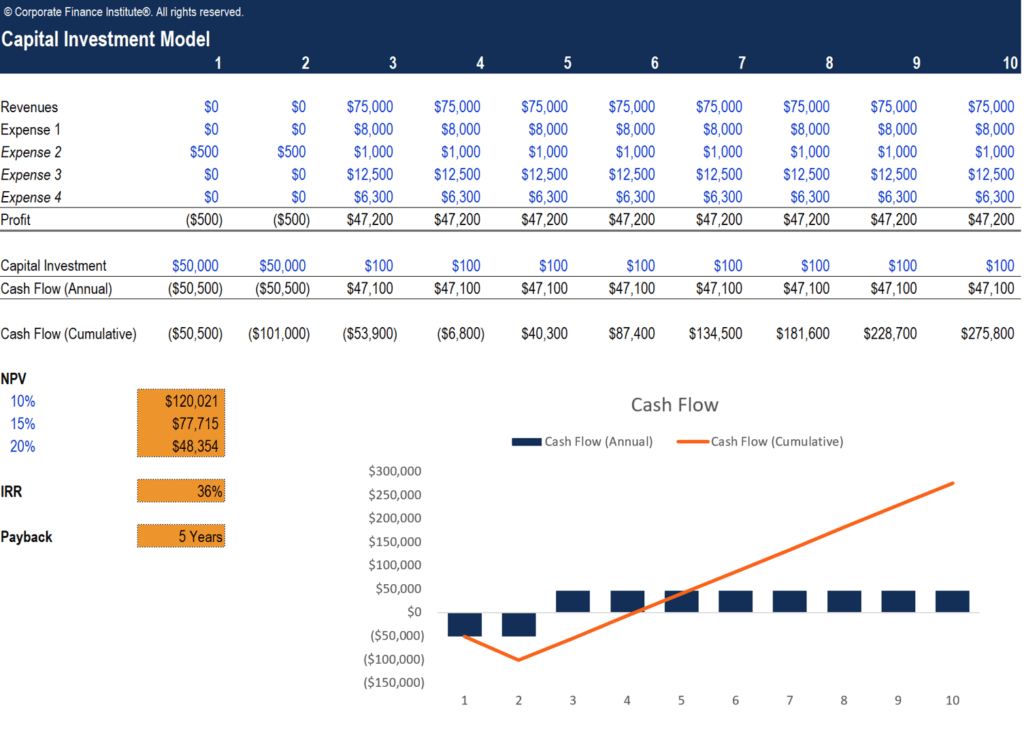
The first step to building a capital investment model is to determine the cash flows for the investment period. In this simplified model, we are presenting the income statement using the minimal number of line items – revenue, expenses, and profit. By subtracting the expenses from the annual revenue we can determine the profit for each year within the investment period, which will be used as cash inflows for the capital investment.
#2 Capital Investment and Cash Flow
Next, we need to determine the amount of capital invested in the project, which equals the cash outflows during the investment period. With that information, we can then calculate the annual cash flows using the following formula:
Cash Flow (Annual) = Profit – Capital Investment
The cash flow line will be the major input in the calculations of net present value (NPV) and internal rate of return (IRR) for this capital investment.
We also need to determine the cumulative cash flow, which is essentially the sum of all cash flows expected from the investment. The cumulative cash flow figures will be used to compute the payback period of the investment.
#3 Net Present Value (NPV)
The net present value (NPV) is the value of all future cash flows over the entire life of the capital investment discounted to the present. In this example, we will determine the NPV using three different discount rates – 10%, 15%, and 20%. This rate is often a company’s weighted average cost of capital (WACC), or the required rate of return investors expect to earn relative to the risk of the investment.
In Excel, you can use the NPV function to find the present value of a series of future cash flows with equal time periods. The formula for the NPV function is = NPV(rate, cash flows).
In this example, the NPV of this capital investment would be $120,021 when the discount rate is 10%, $77,715 when the discount rate is 15%, and $48,354 when the discount rate is 20%. It tells us that when there is a higher risk associated with a capital investment, investors expect to pay less today and a higher return in the future.
#4 Internal Rate of Return (IRR)
The internal rate of return (IRR) is the expected compound annual rate of return earned on a capital investment. IRR is usually compared to a company’s WACC to determine whether an investment is worthy or not. If the IRR is greater than or equal to the WACC, then the company would accept the project as a good investment. Vice versa, the company would reject the investment if the IRR is less than the WACC.
You can use the IRR function in Excel to compute the rate of return based on a series of future cash flows. The formula for the IRR function is =IRR(rate, cash flows).
#5 Payback Period
The last metric to calculate for a capital investment is the payback period, which is the total time it takes for a business to recoup its investment. The payback period is similar to a breakeven analysis but instead of the number of units to cover fixed costs, it looks at the amount of time required to return the investment.
A simple way to calculate the payback period is to count the number of periods until the company earns a positive cumulative cash flow on the investment. In the example provided, the company starts to have positive cumulative cash flow in year 5 and, thus, the payback period for this investment is 5 years.
#6 Cash Flow Chart
Besides calculating the payback period, a cash flow chart is also a good way to visualize the cash flow trend over the investment period and the time when the investment breaks even. In the example above, the column chart in blue represents the annual cash flow of the investment, while the line chart in orange shows the cumulative cash flow over the period.
The point where the orange line intersects with the horizontal axis is the breakeven point, where the company earns zero cumulative cash flow and begins to recognize positive cash flow after paying back all of the initial investment.
Download CFI’s Free Capital Investment Model Template
Complete the form below to download our free Capital Investment Model template!
Learn More
We hope this has been a helpful guide on what is a capital investment model and how to use it to evaluate the return on an investment. CFI offers the Financial Modeling & Valuation Analyst (FMVA)™ certification program for those looking to take their careers to the next level.
If you want to learn more, CFI has all the resources you need to advance your career:
Take your learning and productivity to the next level with our Premium Templates.
Upgrading to a paid membership gives you access to our extensive collection of plug-and-play Templates designed to power your performance—as well as CFI's full course catalog and accredited Certification Programs.
Gain unlimited access to more than 250 productivity Templates, CFI's full course catalog and accredited Certification Programs, hundreds of resources, expert reviews and support, the chance to work with real-world finance and research tools, and more.