Get Certified for Financial Modeling (FMVA)®
Gain in-demand industry knowledge and hands-on practice that will help you stand out from the competition and become a world-class financial analyst.
Every financial analyst has faced it: the dreaded imbalanced 3-statement model. Whether it’s right before a presentation or after hours of work, these errors seem to show up at the worst possible times. Yet imbalances are an inevitable part of building 3-statement financial models in Excel.
Knowing where to look and how to troubleshoot can make all the difference in resolving imbalances quickly. Any lack of alignment among the income statement, balance sheet, and cash flow statement means your financial forecasts are built on shaky grounds. By addressing model imbalances, you can feel confident in the accuracy of your 3-statement model.
To help you troubleshoot, we’ve outlined the 10 most common causes of imbalanced 3-statement models, paired with practical tips to fix them.

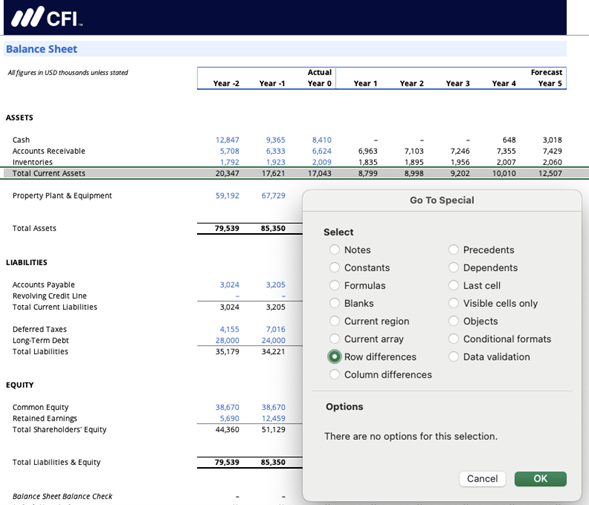
Incorrect totals and subtotals are among the most common culprits of imbalanced models. Subtotals sometimes fail to capture all relevant line items like missing inventory in current assets or excluding deferred taxes in total liabilities.
This imbalance creates cascading errors that impact all three financial statements. These issues are particularly tricky because they are often hidden in a large formula or miscalculated subtotal.
️ How to Fix It
Start by reviewing all key totals and subtotals, particularly balance sheet and cash flow statement subtotals (e.g., total current assets or cash from operations). Excel’s Row Differences function makes it easy to check by highlighting formulas that don’t align.
If a subtotal is missing key line items, add them back and verify using manual checks or either the SUM =SUM(A1:A10) or AutoSUM (Alt + =) functions to ensure nothing is left out.
 Quick Tips
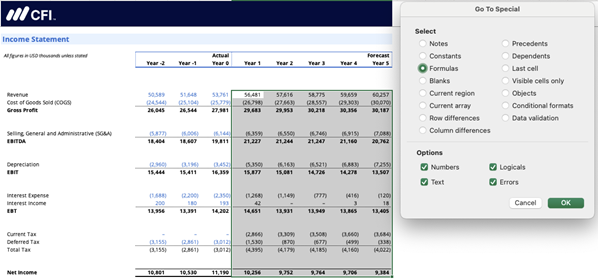
Inconsistent formulas across forecast periods can distort financial projections and create imbalances in the model. A common issue is when calculation methods shift from one year to the next, such as applying a percentage-based forecast for SG&A in one year and hard-coding it in another.
These discrepancies may seem small, but they introduce misalignment in assumptions and outputs. Over time, these inconsistencies can cause errors to compound, making it harder to troubleshoot model inaccuracies.
️How to Fix It
Consistency is key when it comes to formulas. Use Row Differences to spot mismatches in logic or structure, particularly in forecast periods where calculation methods should remain consistent.
Once inconsistencies are identified, align formulas across rows and ensure that forecasting methods remain uniform throughout the model. Keeping formulas consistent improves accuracy and makes troubleshooting and model updates significantly easier.
Quick Tips
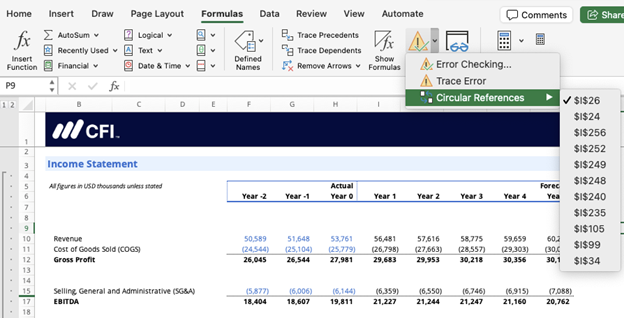
Circular references can either be an intentional part of your model or an unexpected headache. Deliberate circularities, such as those involving interest income or interest expense, are often necessary for accurately reflecting real-world financial relationships.
However, unintentional circularities caused by formula errors or incorrect references can lead to infinite calculation loops, throwing your model into chaos — especially if iterative calculations are not enabled.
️How to Fix It
Enable Iterative Calculations in Excel to handle intentional circularities, such as those involving interest income or expense. For unintended circularities, start by identifying the source using Trace Precedents or Excel’s Circular References tool.
Once located, correct formula errors or misreferences. Intentional circularities should be clearly labeled and managed to avoid confusion or unnecessary troubleshooting later on.
Quick Tips
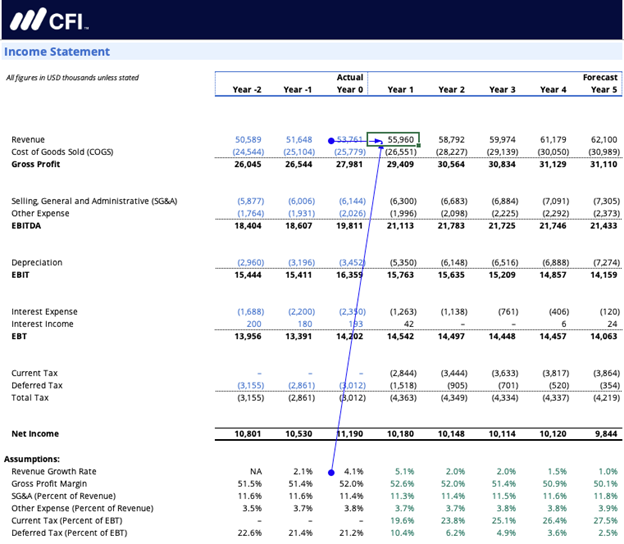
Referencing the wrong rows, columns, or years can quickly derail a 3-statement model.
A common example is using historical data instead of forecast assumptions or pulling inputs from the wrong column in an Inputs tab. These errors often go unnoticed until they distort key outputs, making it essential to spot and fix them early.
️How to Fix It
Correcting references early can prevent errors from snowballing into larger issues.
Double-check your references using Trace Precedents or Trace Dependents, focusing on critical inputs like growth rates and assumptions. Misaligned references often happen when year or column consistency is overlooked, so ensure that Year 1 appears in the same column across all tabs.
Quick Tips
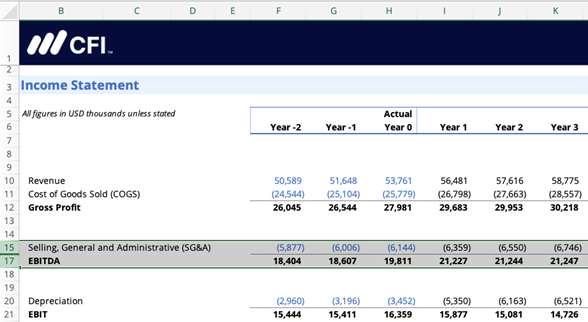
Hidden rows and columns are a deceptively simple issue that can obscure critical data and calculations. For instance, a hidden row in the income statement might contain a key component that is excluded from subtotals, causing the income statement to be incorrect.
Without a deliberate audit, these hidden elements can easily go unnoticed. Look at the highlighted rows in the example below. Rows 15 and 17 are visible, but row 16 is hidden.
️How to Fix It
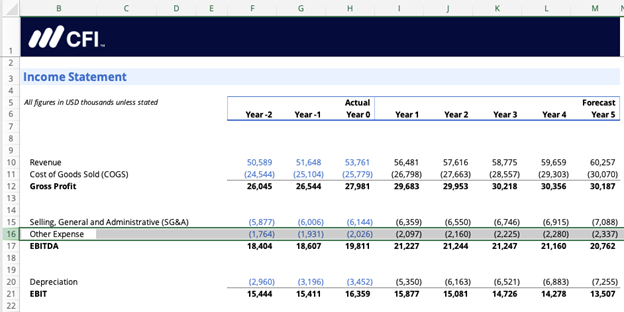
Always check for hidden rows and columns by using Excel’s Unhide feature (Alt + H + O + U). This feature revealed the hidden row 16 in the example, containing the Other Expenses line of the income statement. This example demonstrates why it is essential to check for hidden rows and columns.
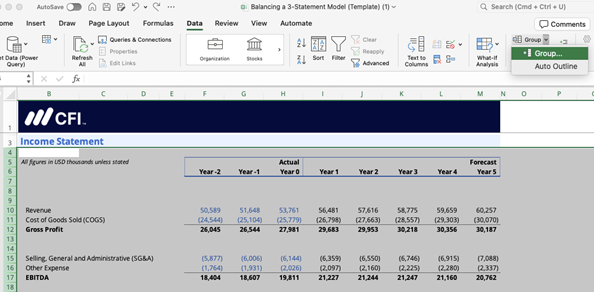
Use Grouping Instead of Hiding Rows and Columns
For better visibility, replace hidden rows with Grouping, which provides a visual cue that data has been collapsed without obscuring key information. This small adjustment improves the transparency of your model and lowers the risk of missing critical details.
Quick Tips
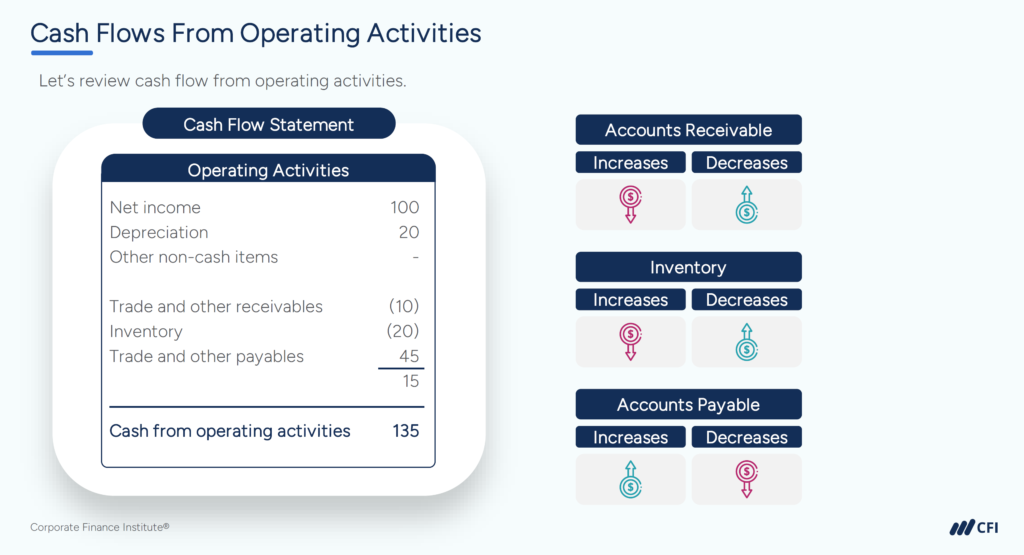
Incorrect signs are a frequent issue, particularly in cash flow statements. A common mistake is flipping the sign on changes in working capital or CapEx, leading to misleading results. These errors often stem from misunderstandings about how increases and decreases in assets and liabilities affect cash flow, making them easy to overlook.
️How to Fix It
Understanding the relationship between assets, liabilities, and cash flow is essential to fixing sign errors. Review your cash flow statement and supporting schedules to ensure the signs are consistent with accounting rules. If something doesn’t add up, double-check the signs in formulas and adjust as needed.
Quick Tips
Small errors in cash flow adjustments can cause major imbalances in your model. If changes in accounts like inventory or accounts receivable aren’t reflected on the cash flow statement, your balance sheet won’t balance.
These issues often arise when links between the balance sheet and cash flow statement are overlooked, making reconciliation a tedious but necessary process.
️How to Fix It
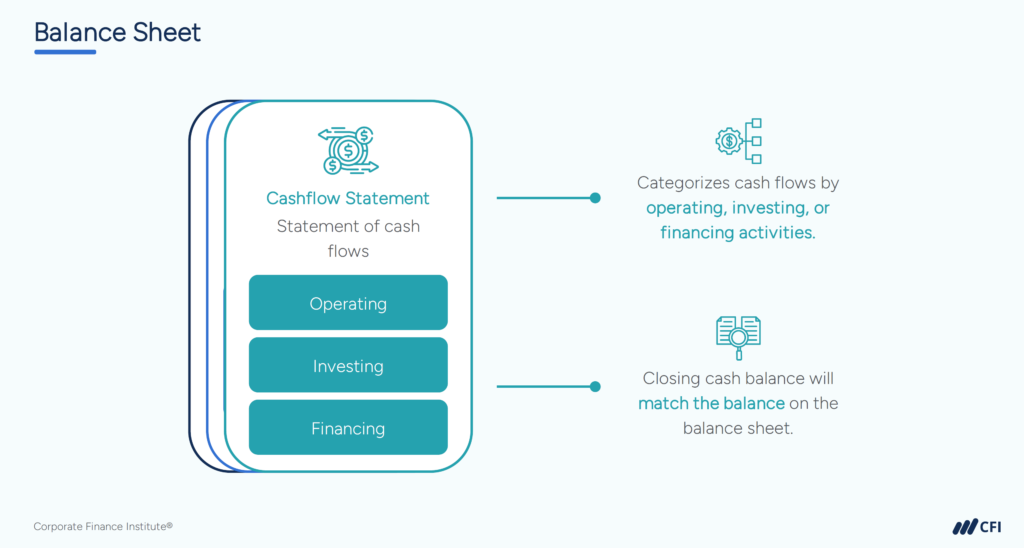
Reconcile changes in the balance sheet with the cash flow statement to identify any missing or misreferenced items. A quick way to troubleshoot is by following the golden rule: every change in a balance sheet account must appear on the cash flow statement.
By systematically reviewing these changes, you can spot gaps or incorrect references and fix them efficiently.
Quick Tips
Plugs may seem like a quick fix, but they create more problems than they solve.
Instead of identifying the root cause of an imbalance, plugs mask the underlying issues, leading to unreliable insights and a false sense of security. While tempting under tight deadlines, this shortcut undermines the integrity of the entire model.
️How to Fix It
Avoid plugs altogether. Instead, use Trace Dependents to systematically audit the model, checking subtotals, references, and formulas across all financial statements.
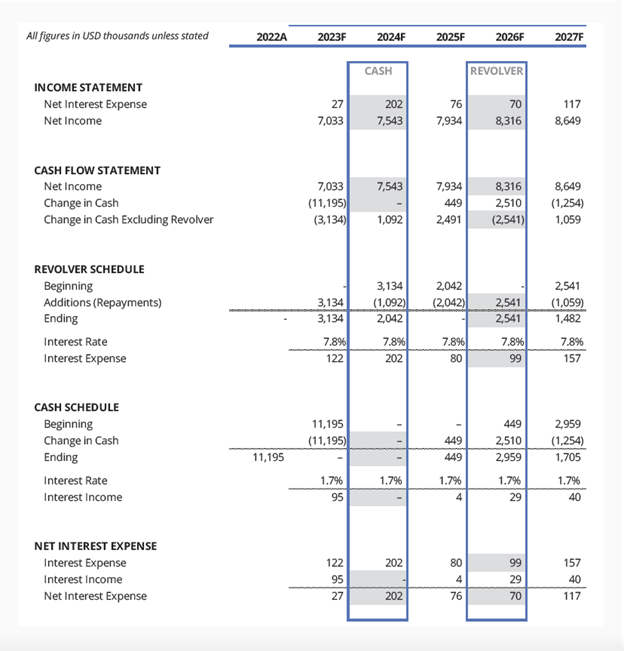
Modeling a revolver (a revolving credit facility) into your financial statements allows cash to adjust dynamically, covering shortfalls without artificial plugs.
Quick Tips
Want to learn more about modeling revolvers? CFI’s comprehensive 3-Statement Modeling course equips you with hands-on modeling skills and balancing models containing revolvers. Explore 3-Statement Modeling now!
Hard-coding values in forecast periods often causes models to lose flexibility and accuracy.
For example, manually entering EBITDA or SG&A locks the model into fixed assumptions, making it difficult to adapt when inputs change. These hard-coded values may seem efficient initially, but they can create inconsistencies that ripple across the model.
️How to Fix It
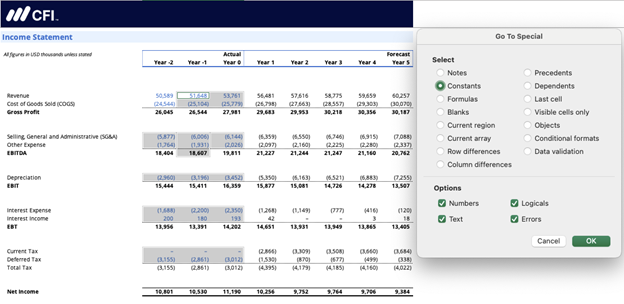
Use Excel’s Go To Special feature (F5 > Special > Constants) to review hard-coded values in your model. Only hard-code historical data, leaving projections and forecasts dynamic by using formulas. This approach makes your model adaptable to new inputs and ensures that updates don’t require extensive manual rework.
Quick Tips
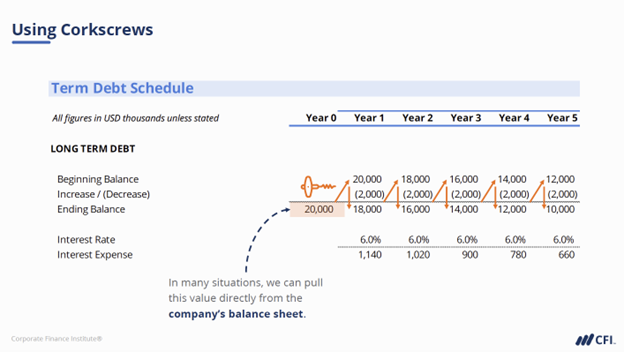
Using beginning balances instead of ending balances is a subtle but impactful mistake in cumulative accounts like retained earnings, deferred taxes, or PP&E.
These errors disrupt the natural flow of balance sheet calculations, as cumulative accounts rely on accurate ending balances to build projections. Overlooking this distinction can lead to persistent and hard-to-diagnose imbalances.
️How to Fix It
Always reference ending balances for cumulative accounts like retained earnings, deferred taxes, and PP&E. If your balance sheet isn’t reconciling, check whether beginning balances have been incorrectly used in formulas.
Ensuring the correct use of ending balances keeps your cumulative schedules accurate and prevents persistent imbalances.
Quick Tips
An unbalanced 3-statement model can lead to inaccurate financial forecasts and wasted hours of troubleshooting. By addressing these 10 common issues, you’ll ensure your Excel models are accurate, reliable, and ready to deliver actionable insights.
Want to strengthen your models and build confidence as a financial analyst? Explore CFI’s Auditing and Balancing a 3-Statement Model course for expert instruction and hands-on exercises to help you audit and balance your models quickly and consistently.
Explore Auditing & Balancing a 3-Statement Model Now!


