Comparable Company Analysis Template
Comparable Company Analysis Template
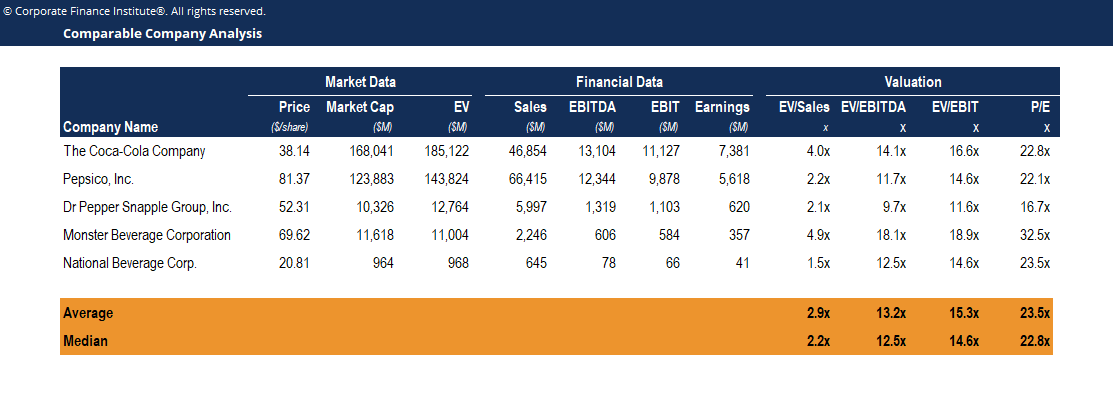
This comparable company analysis template demonstrates how to compute and compare the valuation ratios of industry competitors.
Below is a screenshot of the comparable company analysis template:
Download the Free Template
Download CFI’s Excel template to advance your finance knowledge and perform better financial analysis.
Comparable company analysis (or “comps” for short) is a valuation methodology that looks at ratios of similar public companies and uses them to derive the value of another business. Comps is a relative form of valuation, unlike a discounted cash flow (DCF) analysis, which is an intrinsic form of valuation.
Steps in Performing Comparable Company Analysis
1. Find the right comparable companies
Compile a list of companies operating in the same industry with similar characteristics based on criteria including industry classification, geography, size, growth rate, margins, and profitability.
2. Gather financial information
Once you’ve found the list of companies that you feel are most relevant to the company you’re trying to value, it’s time to gather their financial information.
3. Set up the comps table
In Excel, you will create a table that lists all the relevant information about the companies you’re going to analyze.
4. Calculate the comparable ratios
With a combination of historical financials and analyst estimates populated in the comps table, you can start calculating the various ratios that will be used to value the companies.
5. Use the multiples from the comparable companies to value the company
Connect what you just learned to a clear career path with CFI’s role‑based courses and certification programs.
Additional Resources
For more resources, check out our business templates library to download numerous free Excel modeling, PowerPoint presentation, and Word document templates.
Excel Tutorial
To master the art of Excel, check out CFI’s Excel Crash Course, which teaches you how to become an Excel power user. Learn the most important formulas, functions, and shortcuts to become confident in your financial analysis.

Launch CFI’s Excel Crash Course now to take your career to the next level and move up the ladder!


