Get Certified for Financial Modeling (FMVA)®
Gain in-demand industry knowledge and hands-on practice that will help you stand out from the competition and become a world-class financial analyst.
Inputs, assumptions, processing, and outputs in a cash flow forecast model
With a rolling monthly cash flow forecast, the number of periods in the forecast remains constant (e.g., 12 months, 18 months, etc.). The forecast is rolled forward every time there is a month of historical data to input. Rolling forecasts work best when key cash flow drivers are modeled explicitly and directly drive forecast cash flow inputs. We’ll look at the structure of a robust and flexible monthly cash flow forecast model for a retail store business in the following sections.
Here are five important points to creating a strong input section for a cash flow forecast model:
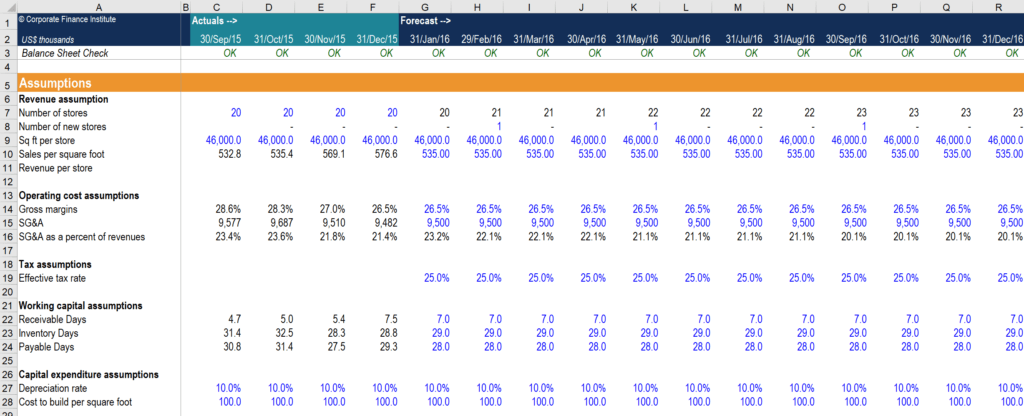
Image Source: CFI’s FP&A Monthly Cash Flow Course.
In our example, a retail store business should start with the number of stores it plans to operate each month, then build up from there, based on the number of square feet and sales per square foot. This will help the business to compute its revenue.
It is important to group all inputs in the assumptions section so users can easily find, add, and modify them.
This helps users of the model to quickly understand and update the model when they first jump into it.
Using identical colors for inputs allows users to easily distinguish between inputs and other calculated outputs. Most financial models use a blue font or yellow shading for inputs, and black font for formulas.
Make notes and comments in cells using keyboard shortcut SHIFT + F2 to indicate where you pull the assumptions from.
The processing section of a cash flow forecast model is located on the right-hand side of the historical results. All cells in this section should be in formulas.
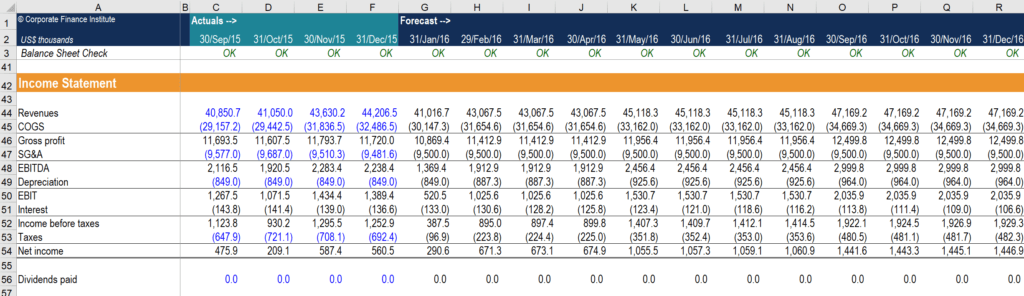
Image Source: CFI’s FP&A Monthly Forecasting Course.
Use step-by-step calculations that are short in length. If the formulas are becoming too long, it is always a good practice to break them down into simple steps to allow efficient auditing and updates.
Everything to the right of the historical results should not be hard-coded. All calculations should draw on explicit input drivers.
Keep only the final figures on the output worksheets, and separate long and complicated formulas and calculations into another section of the model or worksheet.
This enables easy usability and auditability, and builds confidence in the overall process. All formulas should be transparent, clear, and well-documented so people can easily understand how the model works.
The output section contains all the important figures we would like to get out of a cash flow forecast model.
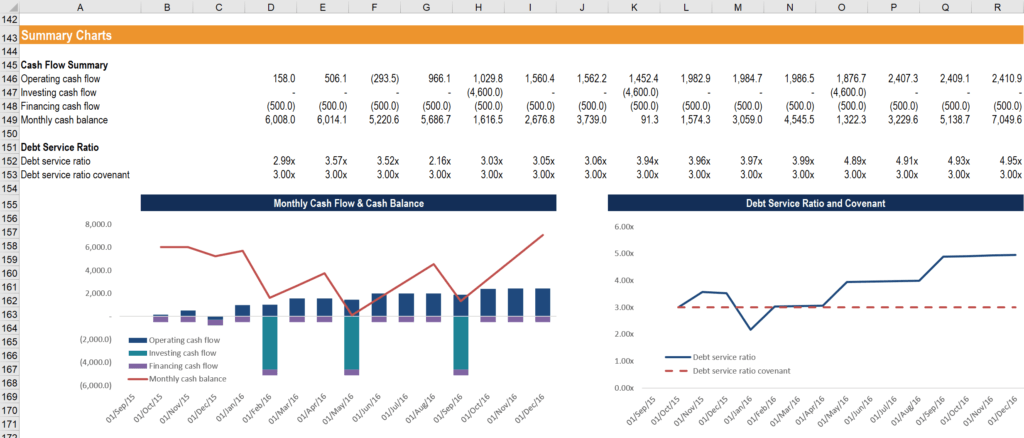
Image Source: CFI’s FP&A Monthly Financial Modeling Course.
Outputs are typically placed at the bottom of the cash flow model and grouped together using the Grouping function in Excel.
Charts and graphs summarize the health of the business, point out any issues that need to be considered or addressed, and make it easy for executive management to understand what is going to happen over the period of the forecast and, thus, make important decisions.
A rolling monthly cash flow forecast can be derived from a balance sheet and income statement driven by explicit inputs. There are three categories of cash flow forecast:
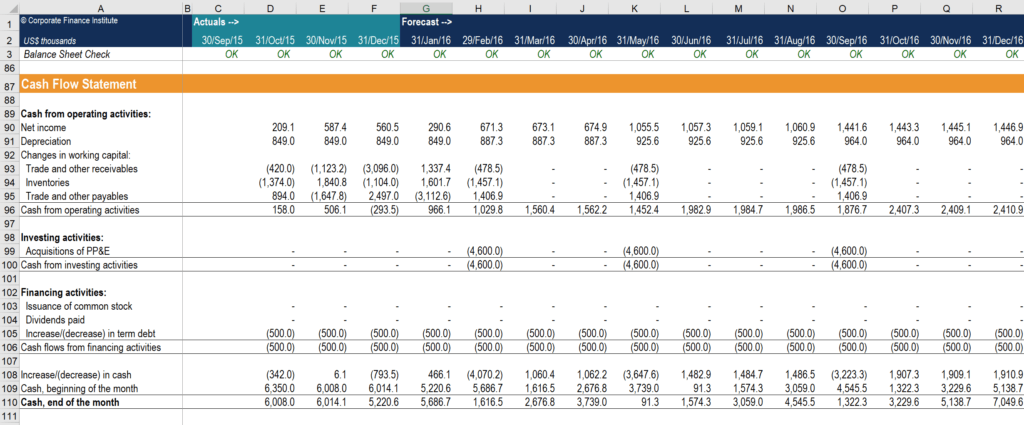
Monthly accounts receivable = Receivable days 30 * Sales
Monthly accounts payable = Payable days 30 * Cost of sales
Monthly inventory = Inventory days 30 * Cost of sales
Connect what you just learned to a clear career path with CFI’s role‑based courses and certification programs.
CFI is the official global provider of the Financial Modeling and Valuation Analyst (FMVA)® designation. To help you advance your career, check out the additional CFI resources below:


