Get Certified for
Capital Markets (CMSA®)
From equities and fixed income to derivatives, the CMSA certification bridges the gap from where you are now to where you want to be — a world-class capital markets analyst.
A downloadable Excel template to calculate the Sharpe Ratio
The Sharpe Ratio, also known as the Sharpe Index, is named after American economist William Sharpe. The ratio is commonly used as a means of calculating the performance of an investment after adjusting for its risk that allows investments of different risk profiles to be compared against each other.
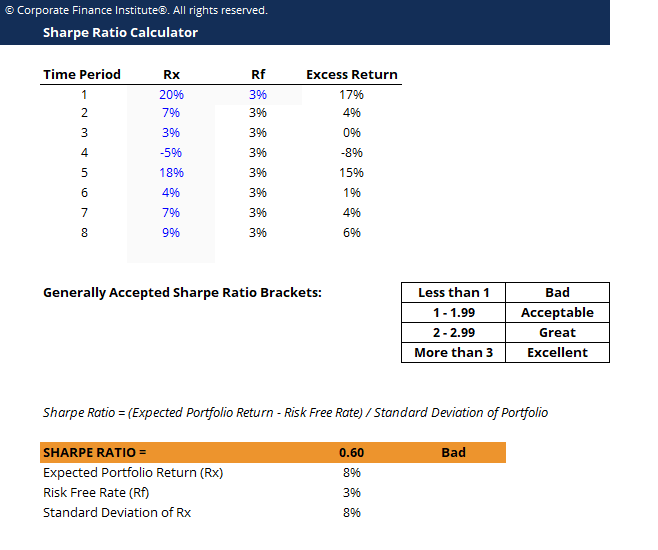
When using the Sharpe Ratio Calculator, a higher value means greater returns for the portfolio relative to the inherent risk, which means a better investment. Because of the simplicity of the formula, the Sharpe Ratio can be used to evaluate a single stock or an entirely diversified portfolio.
Sharpe Ratio = (Rx – Rf) / StdDev Rx
Where:
Firstly, set up three adjacent columns. The first column should have the header “Time Period”, or something similar, to split the returns into its relevant periods. To the right, the second column should have the header “Portfolio Returns” (Rx). The final column should have the header “Risk-Free” (Rf).
In the first column, insert the number of relevant periods that there is available portfolio return data for. Optionally, the type of period can be added. For example, if portfolio returns are sorted by years and there are 4 years available, input “Year 1, Year 2, Year 3, and Year 4” into 4 rows within the first column.
In the second column, insert the appropriate portfolio return in percentage for the relevant periods. In the last column, insert the risk-free rate for this particular type of investment or portfolio. The risk-free rate should be the same across all periods.
To calculate the Sharpe Ratio, find the average of the “Portfolio Returns (%)” column using the “=AVERAGE” formula and subtract the risk-free rate out of it. Divide this value by the standard deviation of the portfolio returns, which can be found using the “=STDEV” formula. Alternatively, depending on the version of Excel in use, the formula for standard deviation may be “=STDEVA.”
Download CFI’s free Excel template now to advance your finance knowledge and perform better financial analysis.
Below are a few general guidelines for evaluating a company’s risk-adjusted return score:
While the thresholds are just general guidelines, keep in mind that Sharpe ratios thresholds may differ for investments of particular fields or industries. However, the thresholds are generally accepted, and it is commonly known that any investment or portfolio that returns a Sharpe Ratio of less than 1 is a bad investment or portfolio.
Thank you for reading CFI’s guide on Sharpe Ratio Calculator. Here are additional resources that can be useful to your career:
Below is a break down of subject weightings in the FMVA® financial analyst program. As you can see there is a heavy focus on financial modeling, finance, Excel, business valuation, budgeting/forecasting, PowerPoint presentations, accounting and business strategy.

A well rounded financial analyst possesses all of the above skills!
CFI is the global institution behind the financial modeling and valuation analyst FMVA® Designation. CFI is on a mission to enable anyone to be a great financial analyst and have a great career path. In order to help you advance your career, CFI has compiled many resources to assist you along the path.
In order to become a great financial analyst, here are some more questions and answers for you to discover:
To master the art of Excel, check out CFI’s Excel Crash Course, which teaches you how to become an Excel power user. Learn the most important formulas, functions, and shortcuts to become confident in your financial analysis.

Launch CFI’s Excel Crash Course now to take your career to the next level and move up the ladder!


