Get Specialized with our Financial Planning & Analysis (FP&A) Program
Support business leaders in their decision-making with best-in-class financial models to evaluate and forecast the financial performance of a company.
Have you ever wondered how businesses prepare for uncertain business conditions, from fluctuations in raw material costs or potential sales volume? In FP&A, analysts rely on sensitivity analysis to test assumptions and predict outcomes. For those new to FP&A, mastering this skill can set you apart early in your career.
Sensitivity analysis is one of the most powerful analyses you’ll use in FP&A. This introduction explores the fundamentals of sensitivity analysis, including what it is, how to build one, and why it’s an essential skill for FP&A analysts.
Sensitivity analysis is a method used to test how changes in certain factors, like costs or sales, affect a final result, such as profit or cash flow.
In technical terms, sensitivity analysis evaluates the relationship between input assumptions (e.g., costs, revenues, interest rates) and outcomes (e.g., profit, cash flow, or net present value).
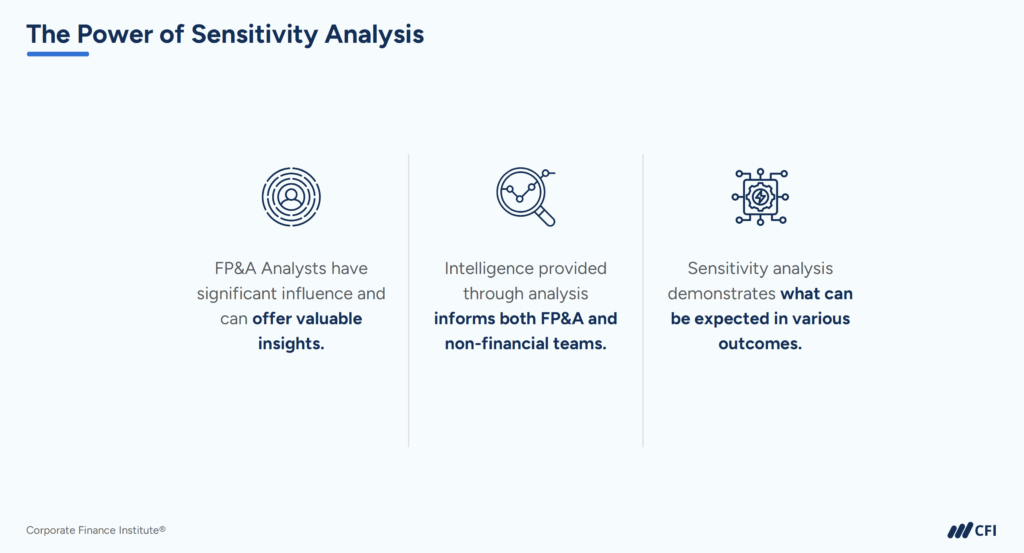
Sensitivity analysis allows FP&A professionals to understand and communicate the impact of changes in key business drivers. Analysts rely on sensitivity analysis to develop accurate budgets and forecasts. CFOs and other executives use the insights from sensitivity analyses to assess the impact of unexpected changes on the business and confidently plan for the future.
FP&A analysts need to know how to perform sensitivity analysis for more than just budgeting and forecasting, such as:
Sensitivity analysis is most helpful in evaluating how multiple interconnected changes, like a supply-chain disruption paired with pricing shifts, could affect a business.
The distinction between sensitivity analysis and scenario analysis is a common question among new FP&A analysts. Understanding the difference helps you know the best analytical tool to use and for what purpose.
Sensitivity analysis focuses on testing isolated changes in specific drivers, like raw material costs or sales volume.
Scenario analysis evaluates the impact of one or more variables and larger events like economic shocks or business expansion on financial outcomes.
For now, we’ll focus on sensitivity analysis — an invaluable skill for any FP&A analyst looking to provide actionable insights to business decision-makers.
To illustrate when to use sensitivity analysis, here are a few examples of how it’s used across industries to address real-world financial challenges:
Evaluate how fluctuations in raw material costs impact gross margins. For example, a 10% rise in material costs might lower margins by 3%. This data helps you identify where the business can make adjustments to maintain profitability.
Analyze how changes in fuel prices affect ticket pricing and overall profitability. If fuel costs rise by 5%, how much would ticket prices need to increase to preserve margins?
Assess how changes in Net Promoter Score (NPS) influence repeat bookings and revenue. A 0.2-point increase in NPS could result in a 15% rise in repeat business, reducing the need for costly new customer acquisition.
Starting with sensitivity analysis can feel intimidating but understanding the steps to create an analysis makes it manageable. The following tutorial guides you through these steps using a real-world example: your manager assigns you to analyze how freight costs affect the company’s total cost of goods sold (COGS).
Sensitivity analysis allows you to model potential freight costs and present the findings to your procurement team. For instance, you could show how a $5 increase per pallet could result in a $50,000 rise in total costs across the company’s 12 locations.
Identify the variables affecting your output and determine which variables are inputs or assumptions. These variables set the foundation for your sensitivity analysis.
In this example, our variables include one input and three assumptions:
Determine plausible ranges for the input variable (freight cost per pallet). This step ensures you test realistic changes to your key driver.
For this analysis, your ranges should represent the $5 increase per pallet. Make sure you also include a baseline:
Build a simple sensitivity model to calculate total freight costs and COGS for each freight cost scenario. Use the following steps in Excel or a similar tool:
Review the outputs and determine what conclusions you can draw from them:
Pro Tip: Remember that not all outcomes are equally likely. When presenting your analysis, consider the probability of different results and focus on the most realistic scenarios.
To make your sensitivity analysis effective and actionable, approach it with a clear strategy and follow these best practices:
By following these best practices, your sensitivity analysis will uncover risks and opportunities and serve as a practical decision-making tool for stakeholders.
Sensitivity analysis is your ticket to navigating uncertainty with confidence. Understanding how specific changes affect financial outcomes allows you to help business leaders make informed decisions and plan for various outcomes. If you’re just starting out in FP&A, adding sensitivity analysis to your skill set will position you as a trusted advisor in strategic planning.
Ready to dive deeper? Explore CFI’s FP&A for New Analysts course and start building career-defining expertise today!
Explore FP&A for New Analysts!
Sensitivity Analysis Table Template
Scenario Analysis vs Sensitivity Analysis


