Get Certified for Financial Modeling (FMVA)®
Gain in-demand industry knowledge and hands-on practice that will help you stand out from the competition and become a world-class financial analyst.
Profit relative to revenue
In accounting and finance, a profit margin is a measure of a company’s earnings (or profits) relative to its revenue. The three main profit margin metrics are gross profit margin (total revenue minus cost of goods sold (COGS) ), operating profit margin (revenue minus COGS and operating expenses), and net profit margin (revenue minus all expenses, including interest and taxes).
This guide will cover formulas and examples, and even provide an Excel template you can use to calculate the numbers on your own.
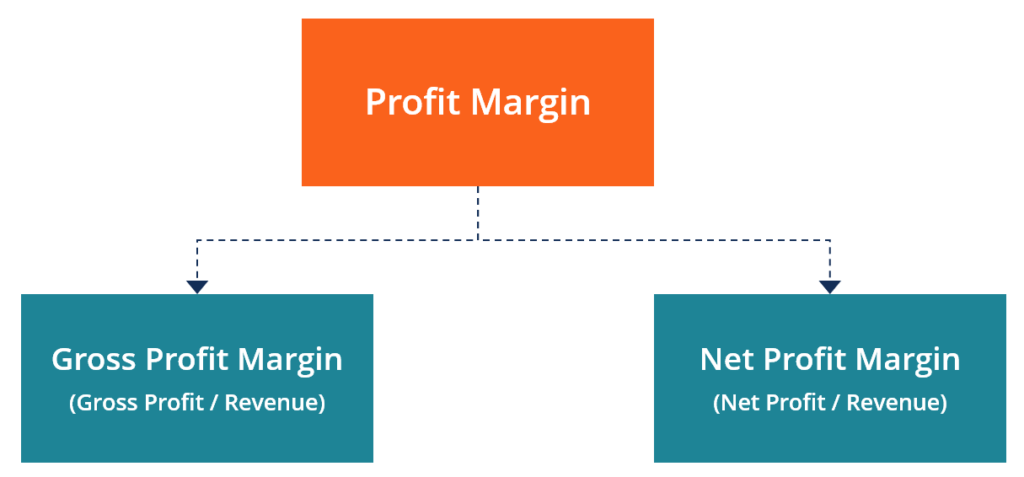
When assessing the profitability of a company, there are three primary margin ratios to consider: gross, operating, and net. Below is a breakdown of each profit margin formula.
Gross Profit Margin = Gross Profit / Revenue x 100
Operating Profit Margin = Operating Profit / Revenue x 100
Net Profit Margin = Net Income / Revenue x 100
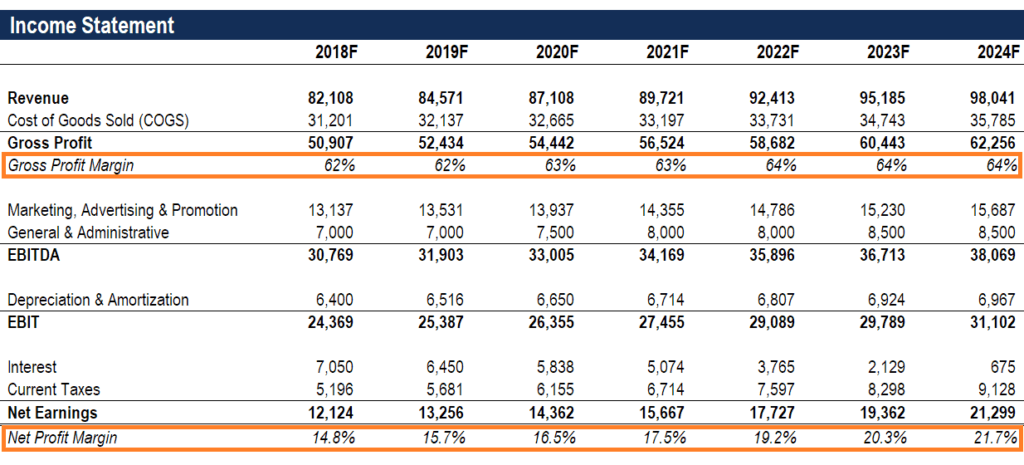
As you can see in the above example, the difference between gross vs net is quite large. In 2018, the gross margin is 62%, the sum of $50,907 divided by $82,108. The net margin, by contrast, is only 14.8%, the sum of $12,124 of net income divided by $82,108 in revenue.
Let’s consider an example and use the formulas displayed above. XYZ Company is an online retailer that sells custom-printed t-shirts. The revenue from selling shirts in 2018 is $700k, the cost of goods sold (the direct cost of producing the shirts) is $200k, and all other operating expenses (such as selling, general, and administrative (SG&A), interest, and taxes) are $400k. Calculate the gross and net profit margins for XYZ Company in 2018.
Income Statement:
$700,000 revenue
($200,000) cost of goods sold
$500,000 gross profit
($400,000) other expenses
$100,000 net income
Based on the above income statement figures, the answers are:
Gross margin is equal to $500k of gross profit divided by $700k of revenue, which equals 71.4%.
Net margin is $100k of net income divided by $700k of revenue, which equals 14.3%.
You may be asking yourself, “what is a good profit margin?” A good margin will vary considerably by industry, but as a general rule of thumb, a 10% net profit margin is considered average, a 20% margin is considered high (or “good”), and a 5% margin is low. Again, these guidelines vary widely by industry and company size, and can be impacted by a variety of other factors.
Below is a screenshot of CFI’s profit margin Excel calculator. As you can see from the image, the Excel file allows you to input various assumptions over a five year period. All cells with blue font and light grey shading can be used to enter your own numbers. All cells with black font are formulas and don’t need to be edited.
As you can see from the screenshot, if you enter a company’s revenue, cost of goods sold, and other operating expenses you will automatically get margins for Gross Profit, EBITDA, and Net Profit. EBIT (earnings before interest and taxes) is the same thing as Operating Profit; EBITDA is slightly more refined, closer to Net Profit.
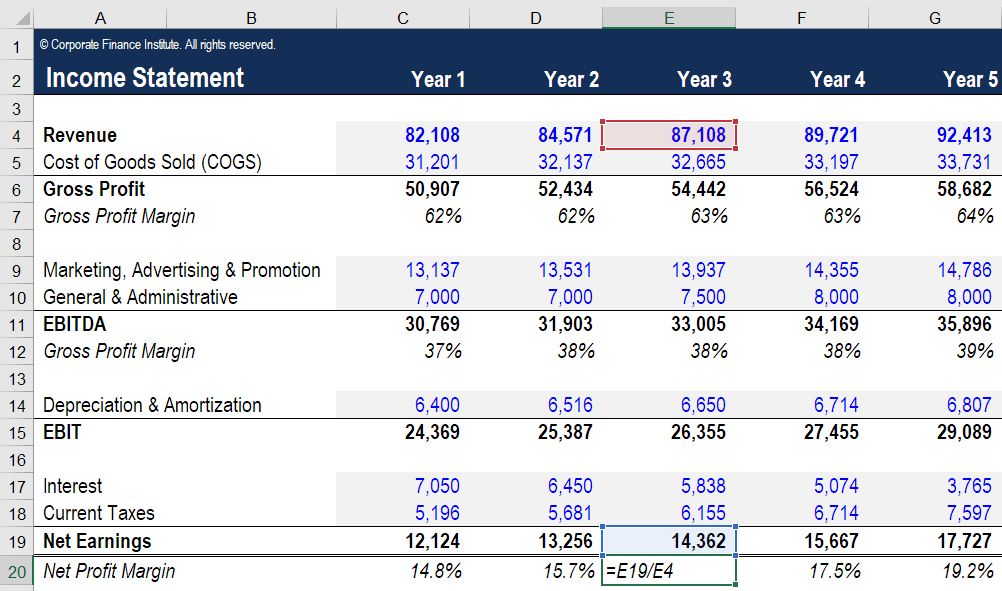
To edit the Excel calculator, you can insert or delete rows as necessary, based on the information you have. For example, to add more expense line items such as “Salaries and Wages”, simply insert a row for each one and add the numbers as appropriate.
Click the button below to download CFI’s free Net Income template!
When analyzing a company, a good analyst will look at a wide range of ratios, financial metrics, and other measures of performance. Below is a list of commonly used performance metrics that analysts often consider when compiling a complete and thorough analysis of a business.
Additional performance metrics include:
Which financial metrics are most important will vary by company and industry. For example, ROE may be a key metric for assessing Company A’s performance, while the most useful metric for analyzing Company B might be revenue growth rate.
Key metrics are often those in which a company’s performance, as indicated by the metric, is substantially different (whether better or worse) from that of most of its competitors. By considering the above factors along with the profitability margins covered in this article, you’ll be well on your way to performing complete financial analyses.
Connect what you just learned to a clear career path with CFI’s role‑based courses and certification programs.
This has been CFI’s guide to Return on Profit Margins. To keep advancing your career, check out these additional CFI resources:


