Get Certified for Financial Modeling (FMVA)®
Gain in-demand industry knowledge and hands-on practice that will help you stand out from the competition and become a world-class financial analyst.
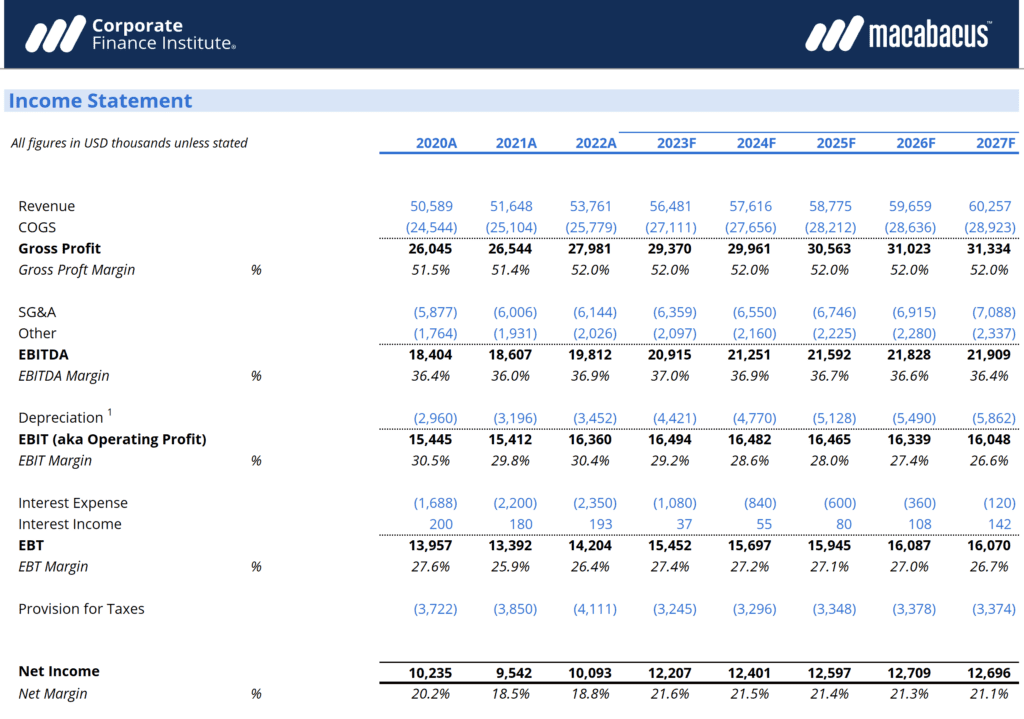
This Excel profit margin template will allow you to calculate the gross profit, EBITDA, operating, and net profit margins.
Below is a preview of the Profit Margin Excel template:
Click the button below to download our free Profit Margin template!
When assessing the profitability of a company, there are several main profit margin ratios to consider. Below is a breakdown of each formula.
Gross Profit Margin = Gross Profit / Revenue x 100
EBITDA Margin = EBITDA / Revenue x 100
Operating, or EBIT, Margin = EBIT / Revenue x 100
Net Profit Margin = Net Income / Revenue x 100
The Gross Margin Ratio, also known as the Gross Profit Margin ratio, is a profitability ratio that compares the gross margin of a company to its revenue. It shows how much profit a company makes after paying off its cost of goods sold (COGS).
Cost of goods sold (sometimes known as cost of sales) is the “direct cost” incurred in the production of any goods or services. This can include material cost, direct labor cost, and direct factory overheads.
For example, if the gross profit margin is calculated to be 20%, that means for every dollar of revenue generated, $0.20 is retained while $0.80 is attributed to the cost of goods sold. The remaining amount can be used to pay off general and administrative expenses, interest expenses, rent, overheads, etc.
Similar to Gross Margin, EBITDA Margin is a ratio that illustrates how much profit a company makes after paying off both the cost of goods sold and selling, general, and administrative expenses (SG&A), excluding depreciation and amortization.
SG&A expenses are overhead costs of a business, many of which are fixed or semi-fixed. Some SG&A costs may relate directly to revenues (the selling component). However, other costs (general and administrative) don’t relate directly to selling products or services but rather to the general ongoing operation of the business. These costs are largely fixed costs.
EBITDA is commonly used as a loose proxy for cash flow since it ignores depreciation and amortization, which are the largest non-cash expenses for many companies.
EBITDA is also frequently used in valuation, as well as in evaluating a company’s creditworthiness.
The Operating Margin indicates how much of a company’s revenue is left after deducting all operating expenses.
Since operating income is also known as EBIT, Operating Margin captures how much money (relative to sales) is left over from the operating part of a business. Operating Margin also shows how much of a company’s revenues are available to pay interest and taxes, which are considered non-operating expenses.
A business that can generate a high Operating Margin is a positive sign for both potential investors and existing creditors.
Net Profit Margin (also known as “Profit Margin” or “Net Profit Margin Ratio”) is a financial ratio used to calculate the percentage of “bottom-line” profit a company produces from its total revenue. It measures the amount of net profit a company obtains per dollar of revenue gained.
Net profit is calculated by deducting all company expenses from its total revenue. Like the other margin calculations, the result of the net profit margin calculation is a percentage: for example, a 10% net profit margin means for each $1 of revenue the company earns $0.10 in net profit.
You may be asking yourself: “What is a good net profit margin?” A good margin will vary by industry, but as a general rule of thumb, a 10% net profit margin is considered average, a 20% net margin is considered high (or “good”), and a 5% margin is low. Of course, these guidelines can vary widely by industry, company size, and a variety of other factors.
By looking at trends in profit margins, analysts can then examine the underlying root causes of profitability. For example, if the gross profit margin decreases in a year, an analyst can dig further into the cost of goods sold to try to determine why. Was it non-recurring items that won’t impact the business going forward or something else?
Additionally, profit margins can be useful in comparing a company’s income statement to the average trends in the industry. By “common sizing” profits to a margin percentage, companies of different sizes can be reasonably compared. Otherwise, it wouldn’t make sense to use actual dollar amounts across multiple companies in an industry.
After downloading the template, you can manually enter the income statement data into the cells with a blue font (blue font for input data is an industry standard, as we discuss in our Financial Modeling Guidelines e-book).
Alternatively, you can use aggregate the data from elsewhere using Excel functions like SUMIFS.
Connect what you just learned to a clear career path with CFI’s role‑based courses and certification programs.


