Get Certified for Financial Modeling (FMVA)®
Gain in-demand industry knowledge and hands-on practice that will help you stand out from the competition and become a world-class financial analyst.
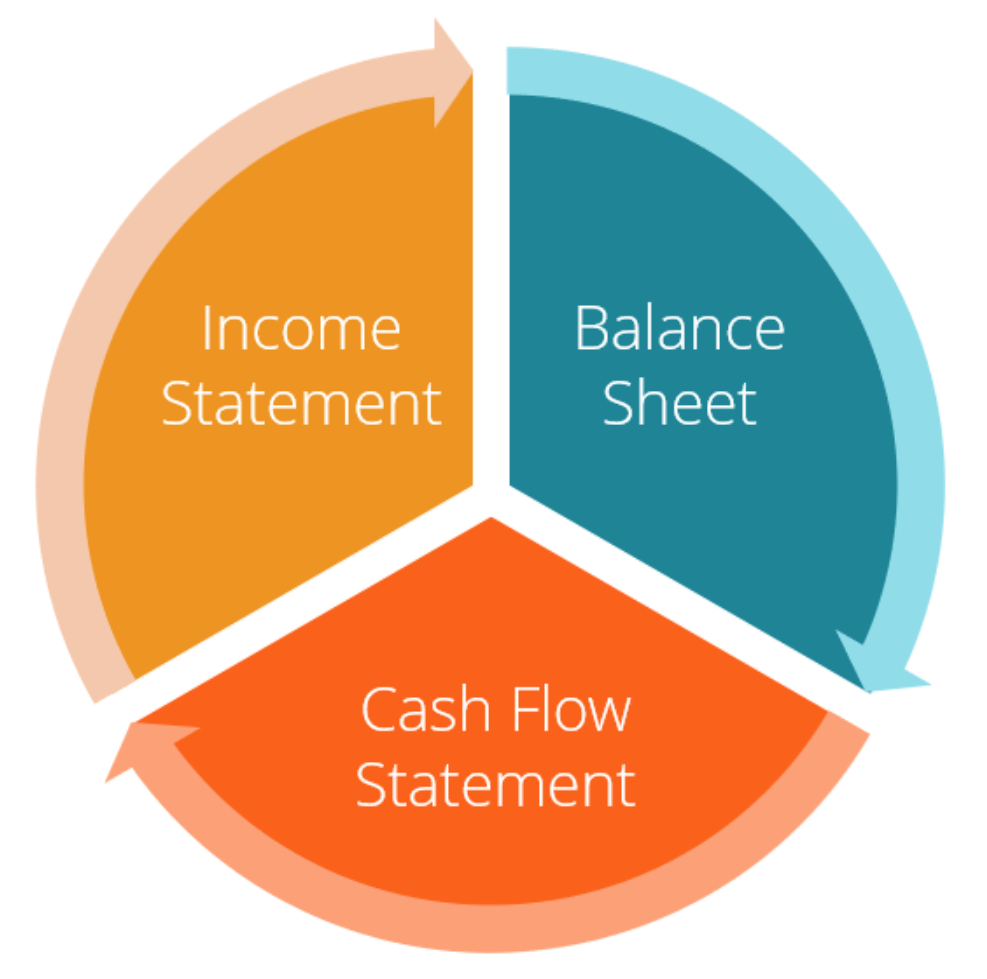
The three financial statements are the income statement, the balance sheet, and the cash flow statement
This guide explains each of the three financial statements, how they connect, and why they matter to investors and analysts.
The three financial statements are:
Each of the financial statements provides important financial information for both internal and external stakeholders of a company. Together, these financial statements provide a complete view of performance, financial position, and cash generation.
The income statement illustrates the profitability of a company under accrual accounting rules. The balance sheet shows a company’s assets, liabilities, and shareholders’ equity at a particular point in time. The cash flow statement shows cash movements from operating, investing, and financing activities.
These three core statements are intricately linked to each other and this guide will explain how they all fit together. By following the steps below, you’ll be able to connect the three statements on your own.
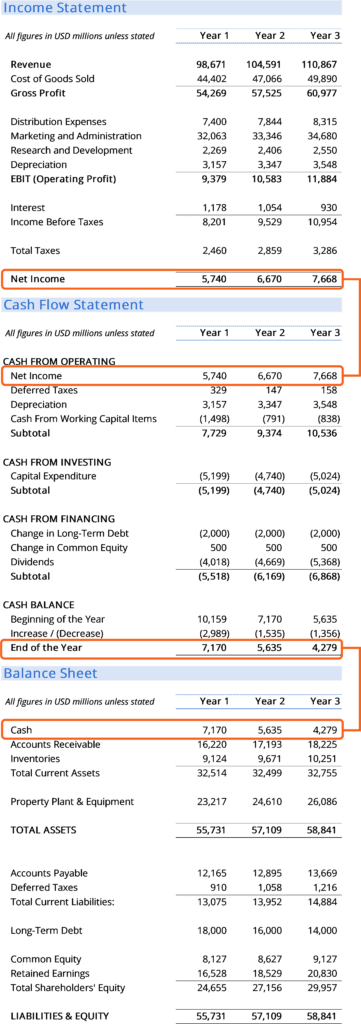
Often, the first place an investor or analyst will look is the income statement. The income statement shows the performance of the business throughout each period, displaying sales revenue at the very top. The statement then deducts the cost of goods sold (COGS) to find gross profit.
From there, gross profit is impacted by other operating expenses and income, depending on the nature of the business, to reach net income at the bottom — “the bottom line” for the business.
The balance sheet displays the company’s assets, liabilities, and shareholders’ equity at a point in time. The two sides of the balance sheet must balance: assets must equal liabilities plus equity. The asset section begins with cash and equivalents, which should equal the balance found at the end of the cash flow statement.
The balance sheet then displays the ending balance in each major account from period to period. Net income from the income statement flows into the balance sheet as a change in retained earnings (adjusted for payment of dividends).
The cash flow statement then takes net income and adjusts it for any non-cash expenses. Then cash inflows and outflows are calculated using changes in the balance sheet. The cash flow statement displays the change in cash per period, as well as the beginning and ending balance of cash.
| Income Statement | Balance Sheet | Cash Flow | |
|---|---|---|---|
| Time | Period of time | A point in time | Period of time |
| Purpose | Profitability | Financial position | Cash movements |
| Measures | Revenue, expenses, profitability | Assets, liabilities, shareholders' equity | Increases and decreases in cash |
| Starting Point | Revenue | Cash balance | Net income |
| Ending Point | Net income | Retained earnings | Cash balance |
Each of the three financial statements is directly linked in a 3‑statement model: net income flows into retained earnings, and changes in balance sheet accounts drive cash flows. Financial models use the trends in the relationship of information within these statements, as well as the trend between periods in historical data to forecast future performance.
The preparation and presentation of this information can become quite complicated. In general, however, the following steps are followed to create a financial model.
Connect what you just learned to a clear career path with CFI’s role‑based courses and certification programs.


