Get Certified for
Business Intelligence (BIDA®)
Develop analytical superpowers by learning how to use programming and data analytics tools such as VBA, Python, Tableau, Power BI, Power Query, and more.
Check out Power BI's leading features for users on the Power BI platform
At the 2021 Microsoft Business Application Summit, Microsoft revealed that Power BI is now used by 97% of Fortune 500 companies. With so many users now on the Power BI platform, a question that often gets brought up is, “What are the top Power BI features I need to know about?”.
Since there are too many to fit into one article, we’ve narrowed them down to create our Top 10 Power BI features list shown below. Some features are only available in the paid versions of Power BI (Pro or Premium), so we’ve marked the availability by Power BI tiers.

Power BI was launched in July 2015. Since then, Microsoft has continued to invest heavily in developing Power BI by adding monthly feature updates. With a vibrant online community, you can influence which new Power BI features get prioritized for development. Vote online for your favorite Power BI ideas here.
Excel worksheets come with a standard limit of 1,048,576 rows. While performance in Excel will slow well before the said row limit, it’s a common requirement for users to analyze datasets over one million rows in size. Power BI compresses your data so you can extract insights from large datasets. With a well-built data model, Power BI can help you analyze datasets containing over 100 million rows.
Power BI also offers useful features for working with truly large datasets that are greater than several hundred million rows. For example, users can set up aggregation tables in Power BI. Aggregations take advantage of pre-calculated data to speed up queries, reducing the time needed to render your reports.
Additional computing power can be unlocked with Power BI Premium. If your organization needs to store very large datasets in Power BI, you can purchase dedicated cloud Power BI Premium instances to enable even faster query times and refresh capabilities.
While Power BI supports many standard data visualizations out of the box, it’s also possible to build your own with custom data visualizations. By adding open-source data-viz libraries from R and Python, analysts can create highly customizable visualizations to add to their next Power BI report.
With around 750 million users, Excel remains the world’s number one data analysis tool. With so many people actively using the tool, it’s no surprise that users often ask for an Excel export of the data displayed in reports and dashboards.
The challenge for BI analysts has been how to offer this flexibility in a way that maintains the integrity of the connected reporting environment.
With that in mind, Microsoft released Analyze in Excel. Excel can connect directly to your underlying Power BI data, so users can do their own tabular and ad-hoc reporting. If you’re comfortable creating PivotTables in Excel, you can use this familiar experience to slice and dice your data, referencing the same datasets used in other Power BI reports.
Finally, users can get the latest data from Power BI datasets by refreshing their Excel connections. This ease of access is a game-changer for organizations stuck between the two platforms.
Power BI can help you build interactive and insightful mapping data visualizations. It comes standard with three different map types: Standard Map, Filled Map (choropleth), or ArcGIS Maps for Power BI.

To learn more about creating powerful dashboards with Power BI, check out CFI’s Power BI Fundamentals course!
Struggling to join, pivot, and filter your data? Power BI makes it easy to import and transform data from a variety of sources using Power Query. It’s designed to be a low/no-code experience, so analysts without SQL or programming knowledge can transform, join, and further manipulate their data with an easy-to-use interface.
Connect to files or databases, choose from a variety of prebuilt SaaS connectors, or you can also connect to the cloud and on-premises databases such as SQL Server, Redshift, Snowflake, and BigQuery. A full list of supported Power Query connectors is available here.
Power BI’s scheduled refresh feature automates the process of refreshing your datasets, freeing you from tedious, manual report updates. By quickly and accurately refreshing your data, insights can be easily surfaced and shared amongst your team.
Power BI offers a feature-rich set of apps for iOS, Android, and Windows 10 mobile devices. Users can view mobile-optimized reports, share insights with colleagues, and set alerts within the mobile apps.
Aligning on one version of the truth across many reports is a challenging undertaking that often ends with inconsistent definitions of metrics and KPIs.
One of Power BI’s most compelling features is its ability to define measures in a data model and then reuse these calculations across numerous connected reports. By defining your KPI calculations in central datasets, you can ensure “Gross Profit” and “Sales Revenue” return the same numbers, regardless of which report you’re viewing.
This feature differentiates Power BI from other data visualization tools, which often define KPIs in each report individually.
Microsoft has made great strides in better integrating the company’s Office 365 products and apps with Power BI. Listed below are a few examples of the integrations available for Power BI and other Microsoft products:
| Microsoft Teams | Power BI Teams app | Find and work with Power BI content within Teams |
| Embed a Power BI report in a Teams channel | Pin a frequently used Power BI report to the top of your Teams channel | |
| Share Power BI reports and visuals within Teams | ||
| Microsoft PowerPoint | Export a Power BI report to PowerPoint | Easily make presentations using data from Power BI |
| Embed a Microsoft PowerPoint presentation in a Power BI app | ||
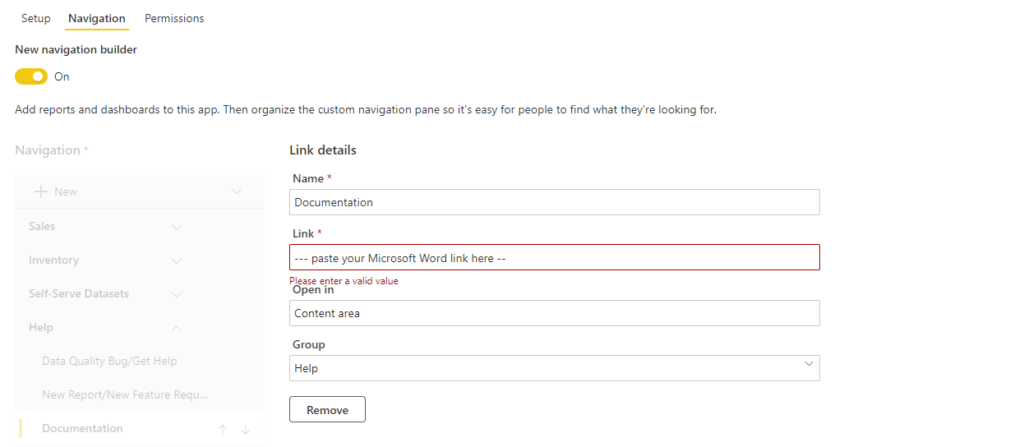
| Microsoft Word | Embed a Microsoft Word document in a Power BI app | By creating a navigation pane in a Power BI app, users can embed a Word document within a Power BI app. For example, you can add report documentation within the app to make it easy for users to understand how the KPIs displayed in your reports are calculated. |
To gain a better understanding of Power BI’s extensive features, check out CFI’s Power BI Fundamentals course!
Connect what you just learned to a clear career path with CFI’s role‑based courses and certification programs.
Thank you for reading CFI’s guide to the leading Power BI Features. To keep learning and advance your career, the following resources will be helpful:


