Supply and Demand
A glance at how supply and demand work
What are the Laws of Supply and Demand?
The laws of supply and demand are microeconomic concepts that state that in efficient markets, the quantity supplied of a good and quantity demanded of that good are equal to each other. The price of that good is also determined by the point at which supply and demand are equal to each other. Supply and demand are usually expressed in a line graph format, with Quantity (the independent variable) on the y-axis and Price (the dependent variable) on the x-axis.
Understanding Supply
Generally speaking, the supply of a good and its price are directly proportional to each other and follow a linear relationship. In other words, as price increases, the supply of that good also increases – as demonstrated by the chart below:
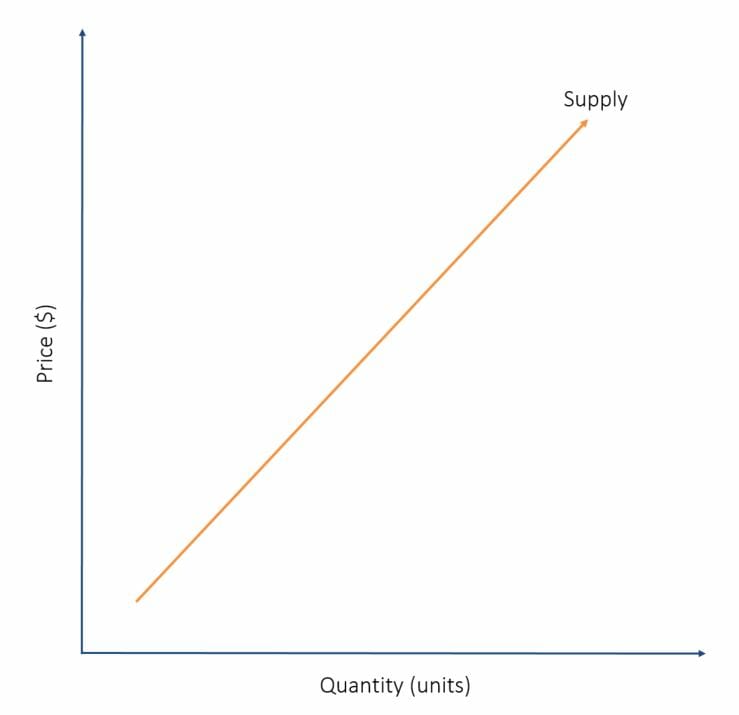
The supply line is seen from a seller’s perspective. The higher the price of a good, the more of that good a seller will want to sell, since doing so will be profitable. Conversely, a low price will not attract many sellers to the market, and the quantity supplied will be lower. Thus, we get a linear relationship.
Understanding Demand
Demand works in the opposite way that supply does, and is inversely proportional to price. In other words, as price increases, the demand for that good will decrease – as demonstrated by the chart below:
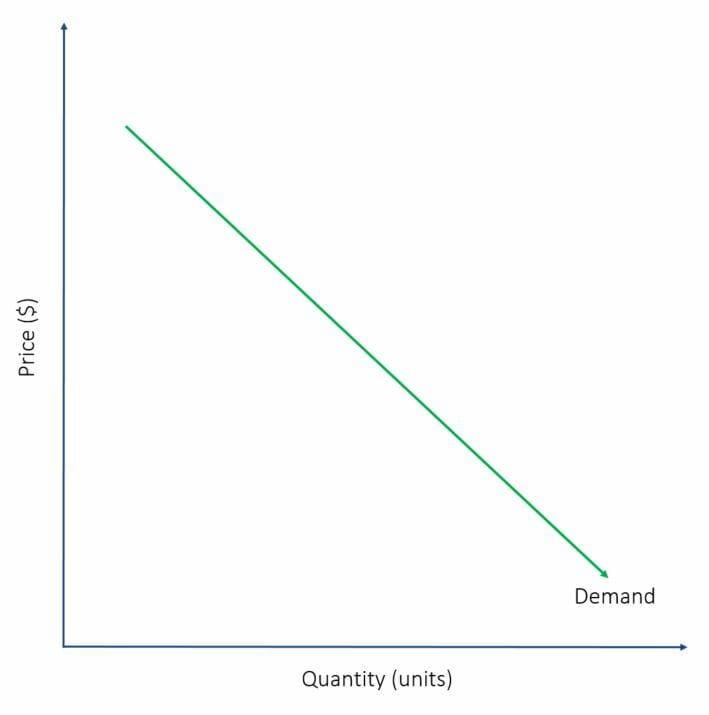
The demand line is seen from a buyer’s perspective. The higher the price of a good, the lower the number of interested buyers, since buyers want to save as much money as possible. Conversely, a low price will attract many buyers to the market, therefore, the quantity demanded will be higher. Thus, we see an inverse relationship.
Supply and Demand Graph
Now, let’s combine the above two graphs into one:
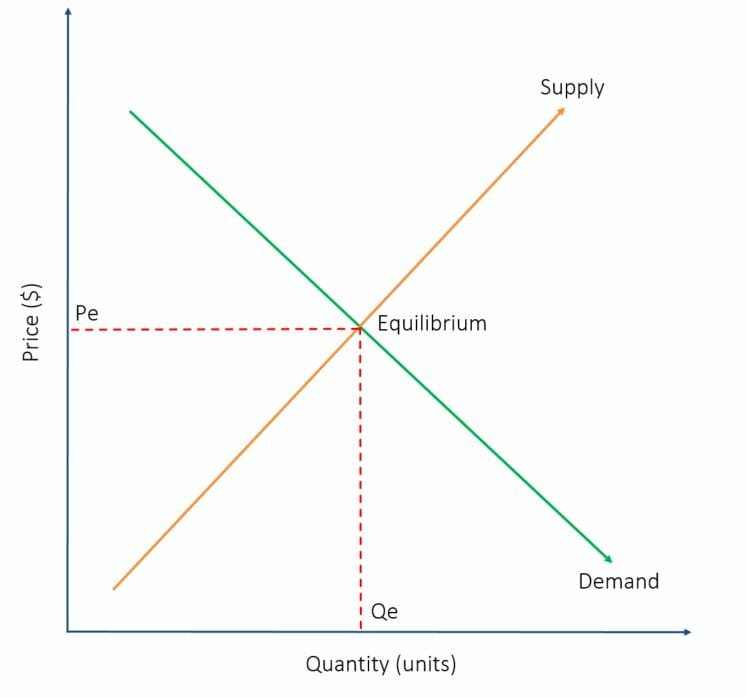
By combining the two graphs, we can observe the point of equilibrium, where the supply and demand lines intersect. Tracing lines directly from the equilibrium point to the x- and y-axes will reveal the Price at Equilibrium (Pe) and Quantity at Equilibrium (Qe), respectively.
Does the Model Hold True in Real Life?
It is important to note that the supply and demand framework does not always happen in real life. It is impossible to calculate Pe and Qe in real life since every individual buyer shows a different willingness to pay for goods, and every seller demonstrates a different willingness to accept prices.
Furthermore, there are a host of other real-life factors that interfere with the supply and demand model, such as:
Monopolies
The supply and demand model assumes perfect competition, which rarely occurs. In some markets, we see a single very powerful producer of goods. Since buyers are unable to find another place to purchase the goods, they are forced to accept whatever price the seller decides to set. This has been the case for goods with inelastic demand (i.e., essential goods) such as oil, medication, or cigarettes.
In such a scenario, the increase in price will deter a small number of buyers from participating in the market, but the majority will still purchase the monopolized goods at a higher price. The practice is hugely profitable for the seller and, in most cases, illegal.

Price Floors
Price floors are price minimums put in place by the government to protect vulnerable sellers. For example, the government might put in a place a price floor on farm goods such as potatoes. Thus, farmers will be guaranteed a certain amount of revenue and will be able to afford a living. In such a scenario, the absence of a price floor may see the price of potatoes plummet to a very low equilibrium price and farmers go into bankruptcy.
Subsidies
Subsidies can be thought of as an alternative to price floors. Thinking back to the potato example, a subsidy will cover a certain portion of production costs for a farmer. Thus, the farmer will have fewer costs to cover and will be able to capture more sales revenue. This will ensure that the farmer can still afford a living even if the equilibrium price of potatoes ends up being very low.
Taxes
Government-imposed taxes are sometimes put in place to boost government revenue. This may be due to political agendas or a lack of available capital to fund public infrastructure projects. A tax on buyers will mean that buyers will need to purchase a good at a price above the equilibrium. However, the additional profits generated this way will be collected by the government rather than the seller.
Additional Resources
CFI is the official provider of the global Commercial Banking & Credit Analyst (CBCA)™ certification program, designed to help anyone become a world-class financial analyst. To keep advancing your career, the additional CFI resources below will be useful:


