Get Certified for Financial Modeling (FMVA)®
Gain in-demand industry knowledge and hands-on practice that will help you stand out from the competition and become a world-class financial analyst.
Guide to analyzing financial statements for financial analysts
Financial statement analysis is the process of evaluating a company’s financial health and performance by reviewing its financial statements, including the income statement, balance sheet, and cash flow statement.
This analysis involves using various metrics and methods to assess profitability, liquidity, solvency, and efficiency, helping stakeholders make informed decisions about the financial status of a company.
Financial statement analysis offers a clear and comprehensive view of a company’s financial health for both internal stakeholders, such as the finance team and business leaders, and external stakeholders, such as investors. This analysis helps stakeholders identify key insights into a company’s performance. It also keeps finance professionals, and investors informed about business and market trends, enabling better decision-making.
In addition, evaluating key financial ratios such as profitability, liquidity, and solvency helps finance teams and business leaders assess resource management and progress toward financial goals. Investors also use ratio analysis to gauge a company’s financial health and growth potential for informed investment decisions.
The benefits of performing financial statement analysis include:
One of the main tasks of an analyst is to perform an extensive analysis of financial statements. This free guide breaks down the most important types and techniques of financial statement analysis.
This guide is designed to be useful for both beginners and advanced finance professionals, with the main topics covering how to analyze (1) the income statement, (2) the balance sheet, (3) the cash flow statement, and (4) rates of return.
Most analysts start their financial statement analysis with the income statement. Intuitively, this is usually the first thing we think about with a business. We often ask questions such as, “How much revenue does it have?” “Is it profitable?” and “What are the margins like?”
In order to answer these questions, and much more, we will dive into the income statement to get started.
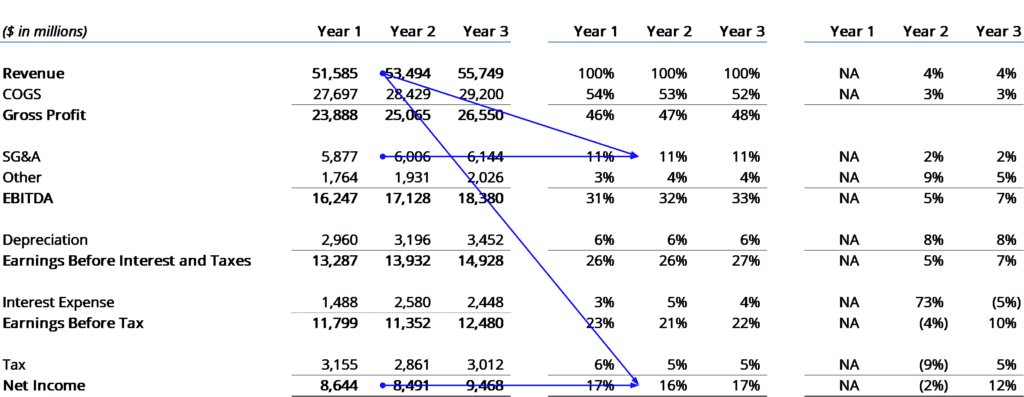
There are two main types of analysis we will perform: vertical analysis and horizontal analysis.
With vertical analysis, we will look up and down the income statement to see how every line item compares to revenue as a percentage.
For example, in the income statement shown below, we have the total dollar amounts and the percentages, which make up the vertical analysis.
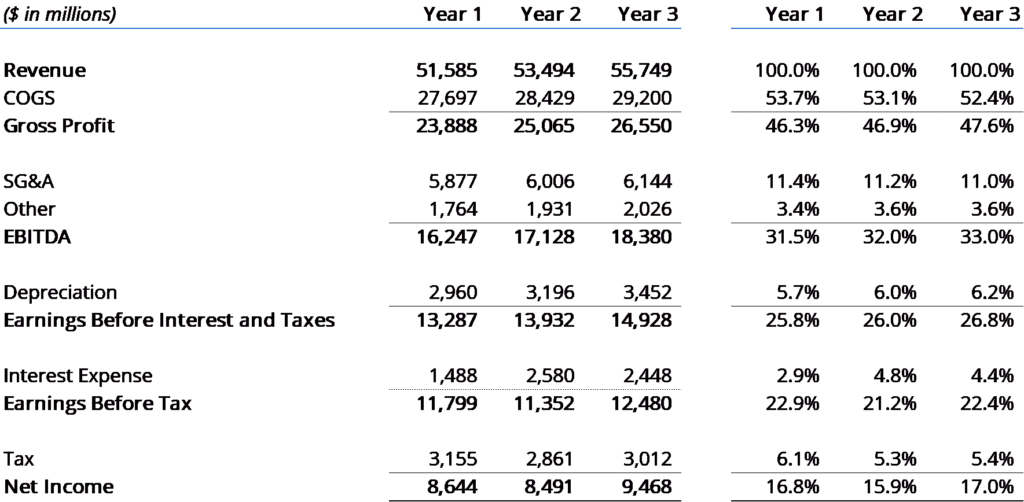
As you see in the above example, we do a thorough analysis of the income statement by seeing each line item as a proportion of revenue.
The key metrics we look at are:
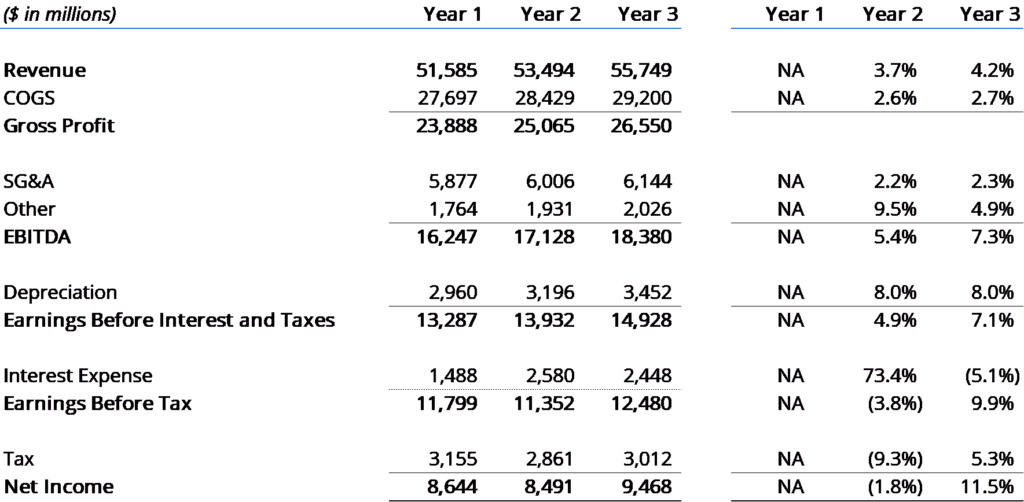
Now it’s time to look at a different way to evaluate the income statement. With horizontal analysis, we look at the year-over-year (YoY) change in each line item.
In order to perform this exercise, you need to take the value in Period N and divide it by the value in Period N-1 and then subtract 1 from that number to get the percent change.
For the below example, revenue in Year 3 was $55,749, and in Year 2, it was $53,494. The YoY change in revenue is equal to $55,749 / $53,494 minus one, which equals 4.2%.
Let’s move on to the balance sheet. In this section of financial statement analysis, we will evaluate the operational efficiency of the business. We will take several items on the income statement and compare them to accounts on the balance sheet.
The balance sheet metrics can be divided into several categories, including liquidity, leverage, and operational efficiency.
The main liquidity ratios for a business are:
The main leverage ratios are:
The main operating efficiency ratios are:
Using the above financial ratios, we can determine how efficiently a company generates revenue and how quickly it sells inventory.
We can also use the financial ratios derived from the balance sheet and compare them historically versus industry averages or competitors. The comparison will help you assess a business’s solvency and leverage.
A thorough analysis should also account for obligations that do not appear directly on financial statements but still affect risk exposure.
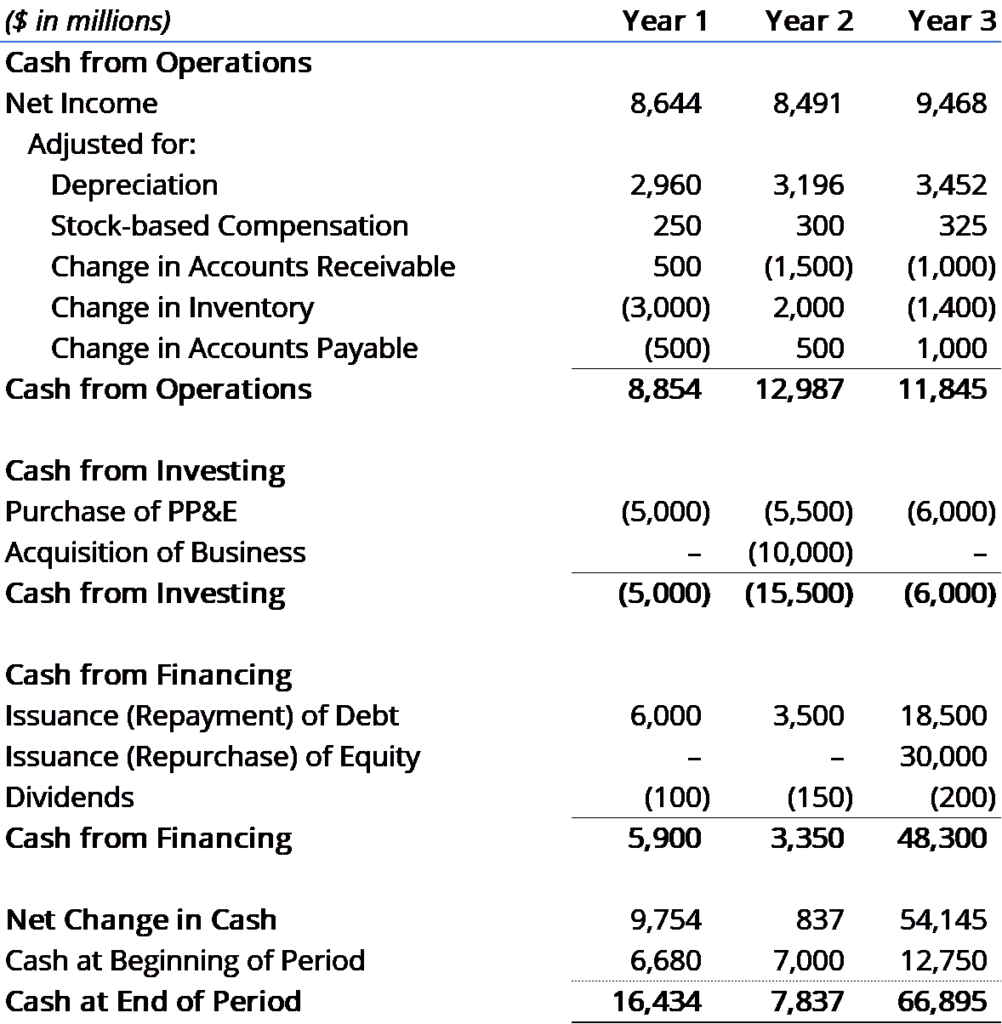
With the income statement and balance sheet under our belt, let’s look at the cash flow statement and all the insights it tells us about the business.
The cash flow statement will help us understand the inflows and outflows of cash over the time period we’re looking at.
Cash flow statement overview
The cash flow statement, or statement of cash flow, consists of three components:
Each of these three sections tells us a unique and important part of the company’s sources and uses of cash over a specific time period.
Many investors consider the cash flow statement the most important indicator of a company’s performance.
Today, investors quickly flip to this section to see if the company is actually making money or not and what its funding requirements are.
It’s important to understand how different ratios can be used to properly assess the operation of an organization from a cash management standpoint.
Below is an example of the cash flow statement and its three main components. Understanding how the three statements relate to each other is also a key building block of financial modeling.
In this section of our analysis of financial statements, we uncover the drivers of financial performance through ratio analysis. By using a “pyramid” of ratios, we can demonstrate how to determine the profitability, efficiency, and leverage drivers for any business.
This is the most advanced section of our financial analysis course, and we recommend that you watch a demonstration of how professionals perform this analysis.
The course includes a hands-on case study and Excel templates that can be used to calculate individual ratios and a pyramid of ratios from any set of financial statements.
The key insights to be derived from the pyramid of ratios include:

By constructing a pyramid of ratios, you will gain a solid understanding of the business and its financial statements.
Analyzing financial statements is essential for understanding a company’s financial position and future potential. It allows corporate finance professionals to uncover patterns and trends, informing strategic decisions and ensuring alignment with financial goals. Additionally, this analysis helps finance teams identify risks early and take corrective actions to maintain the financial stability of their companies.
Additionally, financial statement analysis is the first step investors take when evaluating a company’s profitability and viability as an investment opportunity. It provides a clear view of the company’s financial health, including profitability, liquidity, and debt management, building investor confidence in the company’s ability to generate returns and manage obligations.
Ultimately, financial statement analysis guides internal strategies and attracts external investment by showcasing financial strength and resilience.
Connect what you just learned to a clear career path with CFI’s role‑based courses and certification programs.


