Get Certified for
Business Intelligence (BIDA®)
Develop analytical superpowers by learning how to use programming and data analytics tools such as VBA, Python, Tableau, Power BI, Power Query, and more.
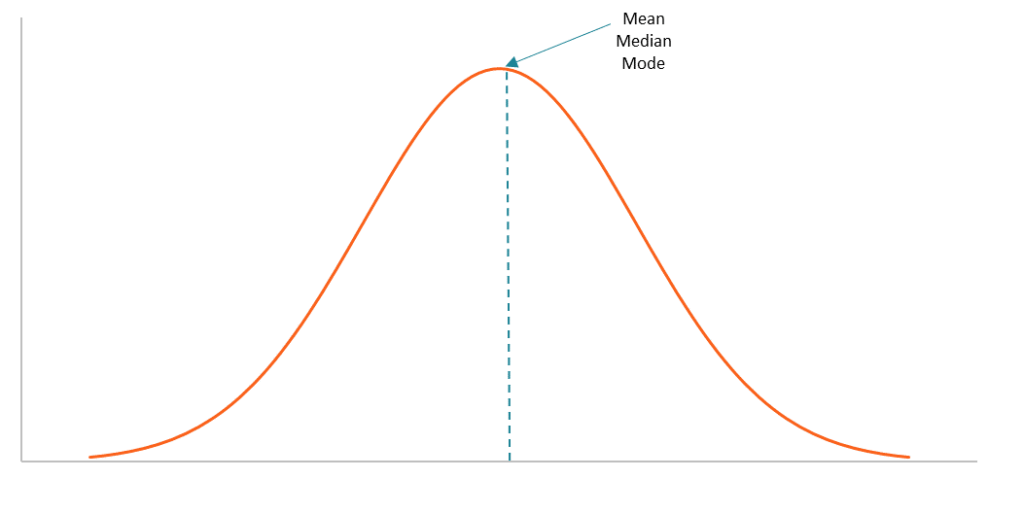
A graph that depicts a normal probability distribution
A bell curve is the informal name of a graph that depicts a normal probability distribution. The term obtained its name due to the bell-shaped curve of the normal probability distribution graph.
However, the term is not quite correct because the normal probability distribution is not the only probability distribution whose graph shows a bell-shaped curve. For example, the graphs of the Cauchy and logistic distributions also demonstrate a bell-shaped curve.
The bell curve is perfectly symmetrical. It is concentrated around the peak and decreases on either side. In a bell curve, the peak represents the most probable event in the dataset while the other events are equally distributed around the peak. The peak of the curve corresponds to the mean of the dataset (note that the mean in a normal probability distribution also equals the median and the mode).
The dispersion of the data on the bell curve is measured by the standard deviation. The probabilities of the bell curve and the standard deviation share a few important relationships, including:
The relationships described above are known as the 68-95-99.7 rule or the empirical rule. The empirical rule is primarily used to calculate the confidence interval of a normal probability distribution.
The concept is extremely important in statistics due to the wide applications of the normal probability distribution. For instance, the normal probability distribution is used as a representation of the distribution of random variables whose real distribution is unknown.
In finance, the normal probability distribution and the bell curve also play significant roles. Financial analysts frequently rely on the normal probability distribution in analyzing the returns of securities. The assumption of a normal distribution is fundamental in many pricing models that intend to predict future returns.
However, one must be careful with the normal probability distribution assumption in finance. In reality, the returns on many securities tend to demonstrate a non-normal distribution. For instance, some distributions are skewed or with a kurtosis that is different from that of a normal distribution.
Connect what you just learned to a clear career path with CFI’s role‑based courses and certification programs.
Thank you for reading CFI’s guide to the Bell Curve. To keep learning and advancing your career, the following CFI resources will be helpful:


