Get Certified for
Business Intelligence (BIDA®)
Develop analytical superpowers by learning how to use programming and data analytics tools such as VBA, Python, Tableau, Power BI, Power Query, and more.
Breaking down data from a dataset into related groups for analysis
Cohort Analysis is a form of behavioral analytics that takes data from a given subset, such as a SaaS business, game, or e-commerce platform, and groups it into related groups rather than looking at the data as one unit. The groupings are referred to as cohorts. They share similar characteristics such as time and size.
Companies use cohort analysis to analyze customer behavior across the life cycle of each customer. In the absence of cohort analysis, businesses may experience difficulties in understanding the life cycle that each customer goes through over a given timeframe. Businesses use cohort analysis to understand the trends and patterns of customers over time and to tailor their offers of products and services to the identified cohorts.

A business sees a lot of data coming in on a daily basis. Analyzing such large volumes of data is not only complex but also an expensive task that requires dedicated staff. However, a business can break customers down into more manageable and actionable cohorts.
Once the company sees trends in how different cohorts use its products, it can identify problems in its marketing techniques and determine when and how to best communicate with different groups or types of customers. The business also uses the broken-down data to design incentives that will motivate customers to keep using their products when they are likely to stop purchasing the products.
Cohorts can be grouped into the following categories:
Time-based cohorts are customers who signed up for a product or service during a particular time frame. Analyzing these cohorts shows the customers’ behavior depending on the time they started using a company’s products or services. The time may be monthly or quarterly, depending on the sales cycle of a company.
For example, if 80% of customers who signed up with the company in the first quarter stick with the company in the fourth quarter but only 20% of customers who signed up in the second quarter stick with the company up to the fourth quarter, it shows the Q2 customers were not satisfied. The company could’ve overpromised during Q2 promotions, or a competitor may be targeting the same customers with better products or services.
Analyzing the time-based cohorts helps in looking at the churn rate. For example, if customers who signed up for the company’s product in 2017 churn out faster than those who signed up in 2018, the company can use this data to find out the cause. It could be that the company is not keeping up with its promises, a competitor offers better quality products, or a competitor is directly targeting your customers with better incentives.
For a SaaS business, the churn rate tends to be high at the start of a given timeframe, and drops as the customers get used to the products. Customers who stay longer with the company tend to love the product and churn at a lower rate than at the start of a time frame. In the absence of cohorts, a company may not identify the exact cause of a high number of customers abandoning the products within a given timeframe.
Segment-based cohorts are those customers who purchased a specific product or paid for a specific service in the past. It groups customers by the type of product or level of service they signed up for. Customers who signed up for basic level services might have different needs than those who signed up for advanced services. Understanding the needs of the various cohorts can help a company design tailor-made services or products for particular segments.
A SaaS company may provide different levels of services depending on the purchasing power of the target audience. Analyzing each level helps in determining which kind of services fit particular segments of your customers.
For example, if the advanced level customers churn at a much faster rate than basic level services, that is an indication that the advanced services are too expensive or that basic level services simply better meet the needs of most customers. Understanding what customers are looking for in a package helps the company in optimizing its notifications to focus on relevant push emails that customers will open and read.
Size-based cohorts refer to the various sizes of customers who purchase a company’s products or services. The customers may be small and startup businesses, middle-sized businesses, and enterprise-level businesses.
Comparing the different categories of customers based on their size reveals where the largest purchases come from. For categories with the least purchases, the company can review any issues with the product and service offering and brainstorm areas for improvement that can boost the level of sales.
In a SaaS business model, small and startup businesses usually churn at a higher rate than enterprise-level companies. Small and startup businesses may have a small budget and be testing low-priced products to see what works for them. Enterprise-level businesses have a larger budget and tend to stick with a product for a longer period of time.
The dataset below gives a random sample of approximately 5,000 customers of a fictional software company. The formulas tabulate the start date of each customer, as well as the number of months away from the start date that the customer was last active in the company’s software. The cohort analysis below is a wonderful tool to differentiate between different cohorts based on time. Note that other cohort segments can split samples by other characteristics than time.
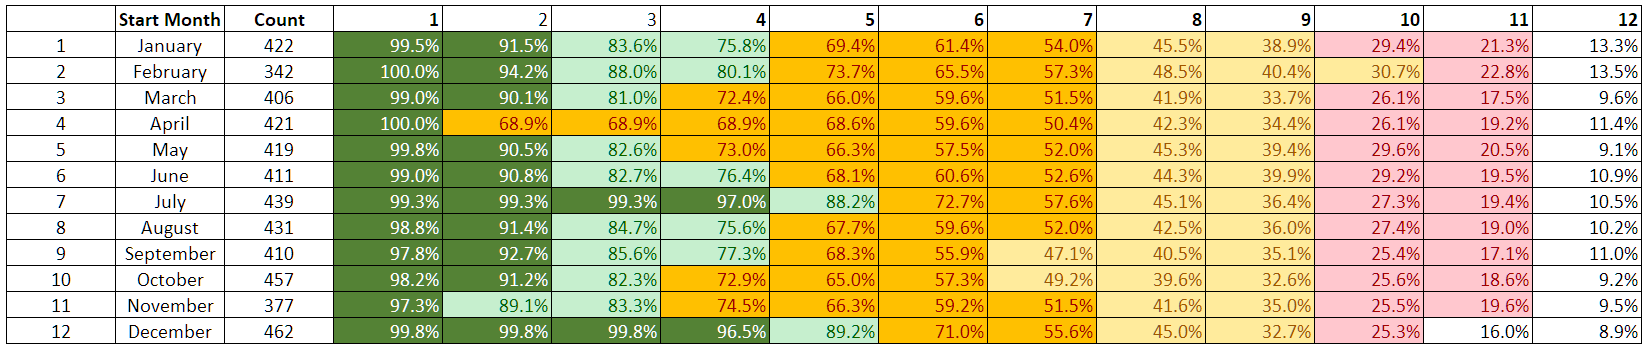
At a quick glance, we can see that the July and December months see better retention rates, where more than 95% of customers stayed until four months in. In contrast, the other months usually see that many customers stay only until two months in. This is perhaps due to a promotion that the company ran in those months, leading to higher retention. One example is Spotify’s summer promotions, where they sell 3-4 months of service for a discounted price.
On the other hand, we see a higher churn rate in April, with a huge amount of customers dropping off after the first month. Here, perhaps there was a glitch in the software the put off a large number of customers.
No one type of cohort analysis is necessarily better than another. Rather, businesses should combine two or more of these segments to gain a deeper understanding of how customers are keeping up with their products.
For example, if the analysis shows that premium subscribers register a higher churn rate than the basic subscribers, then the company can take immediate measures to remedy the situation. If premium customers are churning because of the high costs of the products, the company can review the costs or create more incentives to encourage them to stay.
If the analysis shows that premium customers are continuously searching the help documentation for similar queries, then the company can make a phone or email follow-up to better ensure that customers find a satisfying solution.
Click the button below to download CFI’s free Cohort Analysis template!
Connect what you just learned to a clear career path with CFI’s role‑based courses and certification programs.
Thank you for reading CFI’s guide to Cohort Analysis. For more information on financial analysis and modeling, the following CFI resources will be helpful.


