Get Certified for
Business Intelligence (BIDA®)
Develop analytical superpowers by learning how to use programming and data analytics tools such as VBA, Python, Tableau, Power BI, Power Query, and more.
A probability distribution of a statistic that comes from choosing random samples of a given population
A sampling distribution refers to a probability distribution of a statistic that comes from choosing random samples of a given population. Also known as a finite-sample distribution, it represents the distribution of frequencies on how spread apart various outcomes will be for a specific population.
The sampling distribution depends on multiple factors – the statistic, sample size, sampling process, and the overall population. It is used to help calculate statistics such as means, ranges, variances, and standard deviations for the given sample.
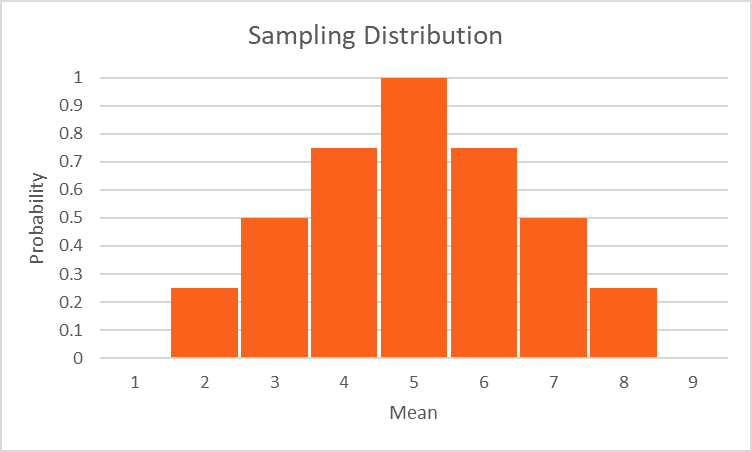
As shown from the example above, you can calculate the mean of every sample group chosen from the population and plot out all the data points. The graph will show a normal distribution, and the center will be the mean of the sampling distribution, which is the mean of the entire population.
It gives you information about proportions in a population. You would select samples from the population and get the sample proportion. The mean of all the sample proportions that you calculate from each sample group would become the proportion of the entire population.
T-distribution is used when the sample size is very small or not much is known about the population. It is used to estimate the mean of the population, confidence intervals, statistical differences, and linear regression.
Suppose you want to find the average height of children at the age of 10 from each continent. You take random samples of 100 children from each continent, and you compute the mean for each sample group.
For example, in South America, you randomly select data about the heights of 10-year-old children, and you calculate the mean for 100 of the children. You also randomly select data from North America and calculate the mean height for one hundred 10-year-old children.
As you continue to find the average heights for each sample group of children from each continent, you can calculate the mean of the sampling distribution by finding the mean of all the average heights of each sample group. Not only can it be computed for the mean, but it can also be calculated for other statistics such as standard deviation and variance.
Since populations are typically large in size, it is important to use a sampling distribution so that you can randomly select a subset of the entire population. Doing so helps eliminate variability when you are doing research or gathering statistical data.
It also helps make the data easier to manage and builds a foundation for statistical inferencing, which leads to making inferences for the whole population. Understanding statistical inference is important because it helps individuals understand the spread of frequencies and what various outcomes are like within a dataset.
The central limit theorem helps in constructing the sampling distribution of the mean. The theorem is the idea of how the shape of the sampling distribution will be normalized as the sample size increases. In other words, plotting the data that you get will result closer to the shape of a bell curve the more sample groups you use.
The more sample groups you use, the less variable the means will be for the sample groups. When the sample size increases, the standard error decreases. Therefore, the center of the sampling distribution is fairly close to the actual mean of the population.
Connect what you just learned to a clear career path with CFI’s role‑based courses and certification programs.
CFI is the official provider of the Business Intelligence & Data Analyst (BIDA)® certification program, designed to transform anyone into a world-class analyst.
To keep learning and developing your knowledge of business intelligence, we highly recommend the additional resources below:


