Doji
A unique candlestick pattern that is characterized by having a small length, which indicates a small trading range
What is a Doji?
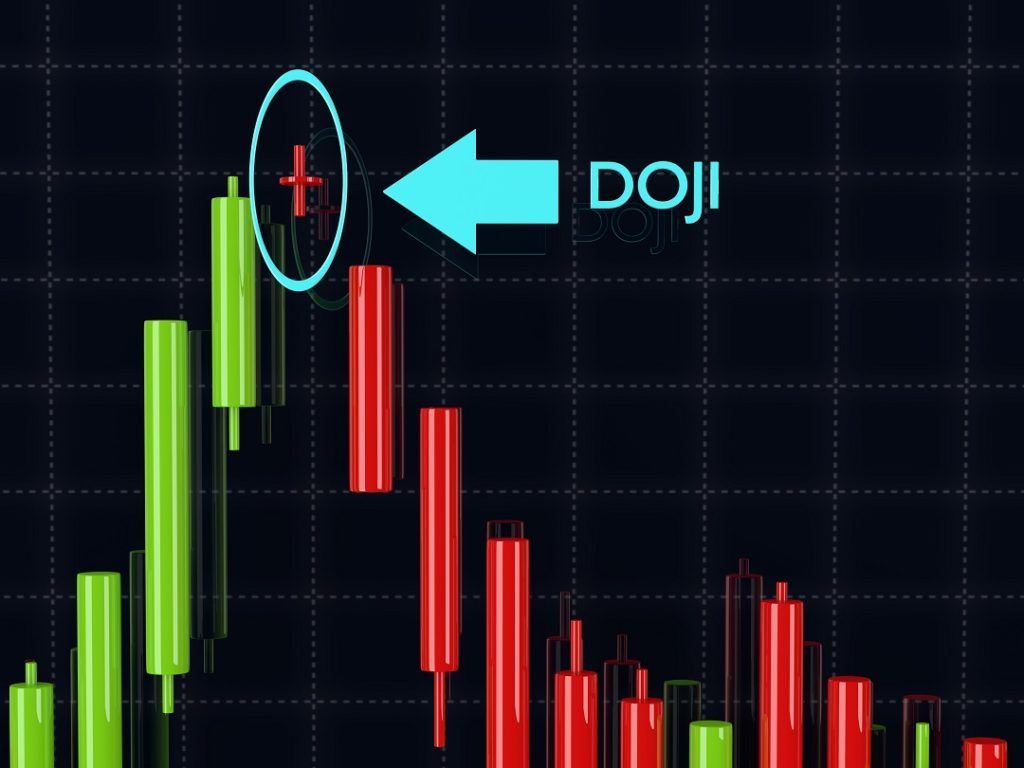
A Doji is a unique pattern in a candlestick chart, a common chart type for trading. It is characterized by having a small length, which indicates a small trading range. The small length means that the opening and closing prices of the financial asset being traded are equal or have small differences. A Doji candlestick can take the form of a plus sign, a cross, or an inverted cross.
The word “Doji” is derived from a Japanese term that means “mistake.” The pattern takes after the name, as it shows that the opening and closing prices of the asset are equal, and it is an unlikely occurrence.
A Doji is used to illustrate market indecision and serves as a signal for a reversal in a market that is either upward or downward trending.
As part of technical analysis for traders, it is important to understand and identify trends on trading charts for currencies, stocks, futures, or bonds. In addition to understanding and identifying trends, traders need to know different chart patterns and what they mean.
Summary
- A Doji is a unique pattern in a candlestick chart. It is characterized by having a small length, which indicates a small trading range.
- A Doji candlestick can take the form of a plus sign, a cross, or an inverted cross.
- In technical analysis, a Doji is an indication of a possible primary trend reversal during a time where there are high trading volumes in a particular direction.
Understanding How Doji is Used
In technical analysis, a Doji is an indication of a possible primary trend reversal during a time when there are high trading volumes in a particular direction.
In cases where the market has been in a downward trend and reaches a new low (which is lower than the last three trading days) and is not able to hold that low, there is a great likelihood that an uptrend can be expected in the days to come.
Similarly, in cases where there has been an upward trend in the market, and the asset trades at a new high (in comparison to the last three trading days) and fails to hold the new high, there is a great likelihood that a downward trend can be expected in the days to come.
Types of Doji Patterns
1. Neutral Doji
Neutral Doji generally forms when the buying and selling powers for a stock in the market are at an equilibrium.
It means that the price of the financial asset closes in the middle of the day’s high and low. Following the trend prior to the Doji, a change in direction can be expected. A neutral Doji looks like a plus sign.
2. Long-legged Doji
Long-legged Doji, which looks like a cross, also indicates that the price of the financial asset being traded closes in the middle of the day’s high and low.
A long-legged Doji forms when the buying and selling powers for a stock in the market are at an equilibrium. This Doji type shows a great amount of indecision among buyers and sellers in the market.
3. Gravestone Doji
Gravestone Doji (which looks like an inverted “T”) signifies that a stock or other financial asset opened and closed at the day’s low. The pattern normally forms at the bottom or end of a downward trend.
The longer upper side of the Gravestone Doji, also known as a shadow, hints at a possible end to the current trend direction in the market and a reverse in direction.
4. Dragonfly Doji
Opposite to the Gravestone Doji, a Dragonfly Doji (which looks a “T”) signifies that a stock or other financial asset opened and closed at the day’s high. It tends to form at the peak of an upward trend and signals a possible trend reversal.
This Doji type also shows a great amount of indecision among buyers and sellers in the market.
Drawbacks of a Doji
A Doji does not occur frequently and is therefore not reliable or a trustworthy indicator on its own. It must be used with other chart pattern analysis techniques in order for a trader to make an informed decision.
It does not always symbolize an extended trend reversal. The direction of the prominent trend may change; however, the longevity of the new direction cannot be guaranteed.
Furthermore, because candlesticks do not necessarily make a provision for price targets, making use of a Doji to produce an informed trade will not guarantee any estimation on the possible gains that can be earned in the trade.
The trade must make use of other technical analysis techniques to determine entry and exit points for trades.
More Resources
CFI is the official provider of the global Commercial Banking & Credit Analyst (CBCA)™ certification program, designed to help anyone become a world-class financial analyst. To keep advancing your career, the additional resources below will be useful:


