Get Certified for
Capital Markets (CMSA®)
From equities and fixed income to derivatives, the CMSA certification bridges the gap from where you are now to where you want to be — a world-class capital markets analyst.
A quantitative or statistical measure used to model or describe a time series
The Exponentially Weighted Moving Average (EWMA) is a quantitative or statistical measure used to model or describe a time series. The EWMA is widely used in finance, the main applications being technical analysis and volatility modeling.
The moving average is designed as such that older observations are given lower weights. The weights fall exponentially as the data point gets older – hence the name exponentially weighted.
The only decision a user of the EWMA must make is the parameter alpha. The parameter decides how important the current observation is in the calculation of the EWMA. The higher the value of alpha, the more closely the EWMA tracks the original time series.
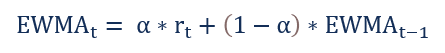
The EWMA’s simple mathematical formulation described below:
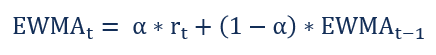
Where:
The EWMA is a recursive function, which means that the current observation is calculated using the previous observation. The EWMA’s recursive property leads to the exponentially decaying weights as shown below:
The above equation can be rewritten in terms of older weights, as shown below:

It can be further expanded by going back another period:

The process continues until we reach the base term EWMA0. The equation can be rearranged to show that the EWMAt is the weighted average of all the preceding observations, where the weight of the observation rt–k is given by:
![]()
Since alpha is between 0 and 1, the weight becomes smaller as k becomes larger. In other words, as we go back further in history, the weight becomes smaller. The fact is illustrated in the chart below, which plots the weights of observation as k increases for different choices of the parameter alpha.

The EWMA can be calculated for a given day range like 20-day EWMA or 200-day EWMA. To compute the moving average, we first need to find the corresponding alpha, which is given by the formula below:
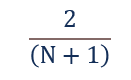
Where:
For example, a 15-day moving average’s alpha is given by 2/(15+1), which means alpha is 0.125. Naturally shorter the lookback period – more closely, the EWMA – tracks the original time series.
The EWMA is widely used in technical analysis. It may not be used directly, but it is used in conjunction with other indicators to generate trading signals. A well-known example is the Negative Volume Index (NVI), which is used in conjunction with its EWMA. A buy signal is generated when the NVI crosses above its 250-day EWMA.
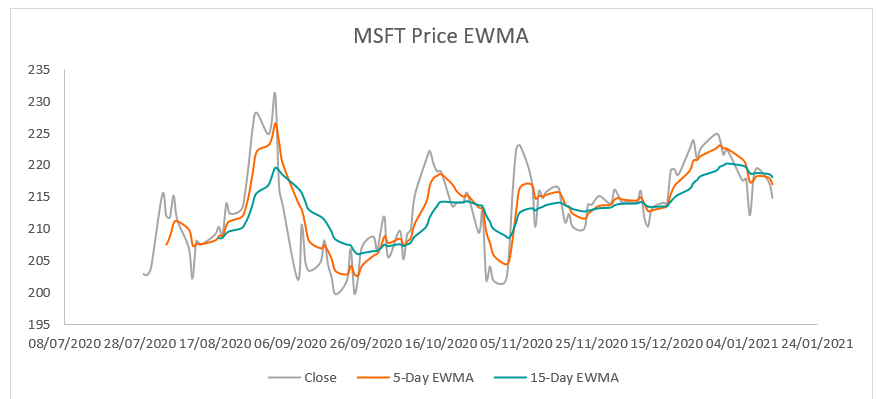
The EWMA can also be used in a simple crossover strategy, where a buy signal is generated when the price crosses the EWMA from above, and a sell signal is generated when the price crosses the EWMA from below.
Another application of the EWMA in technical analysis is that it can be used as support or resistance levels. For this purpose, it is better to use longer moving averages, usually longer than a 20-day moving average.
The following chart shows the 5-day and 15-day EWMA for the series of MSFT stock price:
The exponentially weighted moving average is widely used in computing the return volatility in risk management. There are various methods of computing the return volatility of a price series, like the historical standard deviation method, the EWMA models, and the GARCH model.
The standard deviation method weighs all observations equally and often understates the volatility. The GARCH model is a complex statistical model based on the EWMA model. The EWMA model strikes the perfect balance between complexity and accuracy; hence, it is a very popular approach to estimating volatility.
Volatility can be estimated using the EWMA by following the process:
The volatility number is then used to compute risk measures like the Value at Risk (VaR). It can also be used for option valuation, where volatility is an input parameter to the Black-Scholes-Merton formula.
Connect what you just learned to a clear career path with CFI’s role‑based courses and certification programs.
Thank you for reading CFI’s guide on Exponentially Weighted Moving Average (EWMA). To keep learning and developing your knowledge base, please explore the additional relevant resources below:


