Get Certified for
Capital Markets (CMSA®)
From equities and fixed income to derivatives, the CMSA certification bridges the gap from where you are now to where you want to be — a world-class capital markets analyst.
A Japanese candlestick-based technical trading technique that uses candlestick charts to represent and visualize market price data
The Heikin-Ashi technique is a Japanese candlestick-based technical trading tool that uses candlestick charts to represent and visualize market price data. It is used to identify market trend signals and forecast price movements. The Heikin-Ashi method uses average price data that helps to filter out market noise.
The absence of market noise results in a clear illustration of market trends and direction which helps determine potential price movements. The trading technique assists traders in identifying when they should hold on to a trade, pause a trade, or identify if a reversal is about to occur. Traders can adjust their positions accordingly, i.e., either avoid making losses or lock in a profit on the chosen position.
The Heikin-Ashi trading technique was developed by Munehisa Homma in the 1700s. The technique shares some characteristics with the traditional candlestick charts used in trading but differs in how the values for candlesticks are computed. In Japan, the word Heikin means “average” or “balance,” and the word Ashi means “bar” or “foot.” Hence, Heikin-Ashi means “average bar,” resonating with the trading technique, which uses the average price of the security.
The main difference between the traditional candlestick chart and the Heikin-Ashi chart is that the latter uses a modified formula based on two period moving averages instead of open, high, low, and close prices. Hence, the technique generates a smoother chart making it easier to spot trends and reversals. The Heikin-Ashi charts also obscure gaps and some price data.
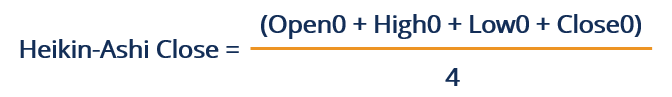
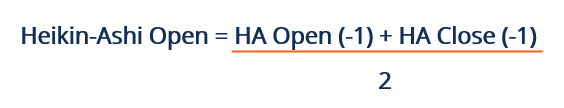
When calculating the Heikin-Ashi formula, we use the open-close data from the previous period and the open-high-low-close (OHLC) data from the current period. Modified OHLC values are displayed as candlesticks. The computations are as given below:

![]()
Where:
Heikin-Ashi data can be of different time frames, i.e. intraday, weekly, or monthly, etc. The HA Open is always set to the midpoint of the body of the previous bar, and the HA Close is calculated as the average price of the current bar. The HA High is the highest value among the current high, HA Open, and HA Close. HA Low is the lowest value among the current low, HA Open, and HA close.
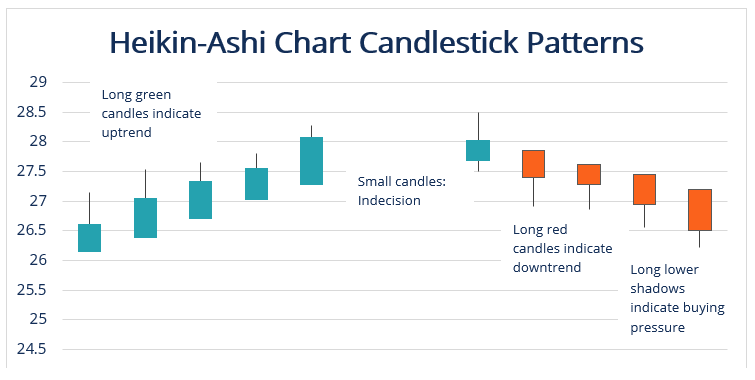
The color of the Heikin-Ashi chart candles is usually red during a downtrend and green during an uptrend. However, different color variants have been known to be used. The indication of a potential change in the trend is given by a change in the color of the HA candle.
We’ve used stock data for a listed entity from February 2020 to June 2020 to generate figures for the Heikin-Ashi chart below.
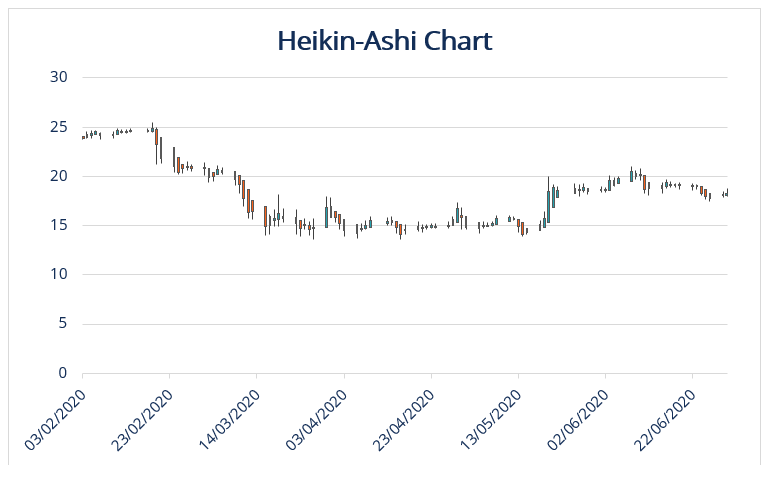
The Heikin-Ashi chart has smooth directional moves with more successive bars of the same color which gives a clearer picture of price movements. The Heikin-Ashi chart shows a few differences from the traditional candlestick chart.
The traditional candlestick chart pattern changes colors from green to red and vice versa, making it difficult for traders to interpret and identify trends. The Heikin-Ashi chart removes the noise and displays consecutive colored candles, making it that much easier to interpret and identify prior price movements and current trends.
The Heikin-Ashi technique reflects the trend prevailing in the market through indicator signals. There are two main aspects of the Heikin-Ashi indicator signals; trend strength and trend reversal.
The first aspect is measuring the strength of the trend. Small consolidations and corrections may not be visible on the chart due to the smoothing effect of the indicator. Hence, in order to trade in the trend with the Heikin-Ashi technique, it is advisable to use a trailing stop to widen the rewards of trading within the trend. It is recommended that a trader should stay in the trend to profit from it if the trend is strong. Below are the different kinds of trends for Heikin-Ashi:
Bullish trend: A strong signal for an uptrend shown by the presence of a lot of consecutive green candlesticks without lower shadows.
Bearish trend: A strong downtrend signal is shown by a lot of consecutive red candlesticks without upper wicks.
Triangles: There are three types of Heikin-Ashi triangles being ascending, descending, and symmetrical ones. If the indicator breaks above the upper boundary of a symmetrical or ascending triangle, it’s very likely that the uptrend will persist. If candles drop below the bottom line of the descending triangle, the bearish trend will continue and strengthen.
A trend reversal signal helps in the determination of the time to exit a previous trend-following trade and enter a new trend. By identifying a reversal signal, a trader is able to avoid losses by entering a new trade instead.
Doji candlestick: A candlestick with a small body and long shadows. It always signals the presence of market uncertainties. When it comes to the Heikin-Ashi, it signals a trend reversal.
Wedges: There are two types of wedges, rising and falling wedges. Wedges are also a little more like triangles. A rising wedge indicator requires a trader to wait until the candlestick breaks below the indicator’s bottom line. If a falling wedge is present, a trader should wait for the price to break above the upper line, and the downtrend will reverse.
Below are some Heikin-Ashi strategies that can be utilized for the benefit of traders to increase their profits and margins.
This is the most common strategy for the Heikin-Ashi technique i.e. to identify the beginning of a strong uptrend or downward trend. Signal indicators of Heikin-Ashi are normally considered very reliable and are rarely wrong.
Hence, traders can ride the trend profitably due to the credibility of the Heikin-Ashi trend signal. With the emergence of a bullish trend, traders with short positions may exit while those with long positions should increase and consolidate their positions.
Identifying candlesticks with no shadows is a very credible signal that a strong bullish trend is starting. This strategy is one of the prime Heikin-Ashi strategies because of its record performance and success rate.
The greater the sequence of candlesticks with no tails, the stronger the expected trend will be. Equally so, identifying candlesticks with no upper shadows, traders should expect a new stable downward bearish trend to continue.
The emergence of candles with small bodies is a signal that traders should be aware of and take notice. These candles are used to signal when a trend is about to pause or reverse. Hence, when traders notice this, they move to open new positions in response to an ending trend.
However, traders should be cautious as the trend might be pausing and not necessarily reversing. In that case, skill is required on the part of the trader to determine if it is really a reversal coming or just a trend pause.
Thank you for reading CFI’s guide on the Heikin-Ashi Technique. To keep advancing your career, the additional CFI resources below will be useful:


