Get Certified for
Capital Markets (CMSA®)
From equities and fixed income to derivatives, the CMSA certification bridges the gap from where you are now to where you want to be — a world-class capital markets analyst.
A technical indicator that foreshadows an increased probability of a looming stock market crash
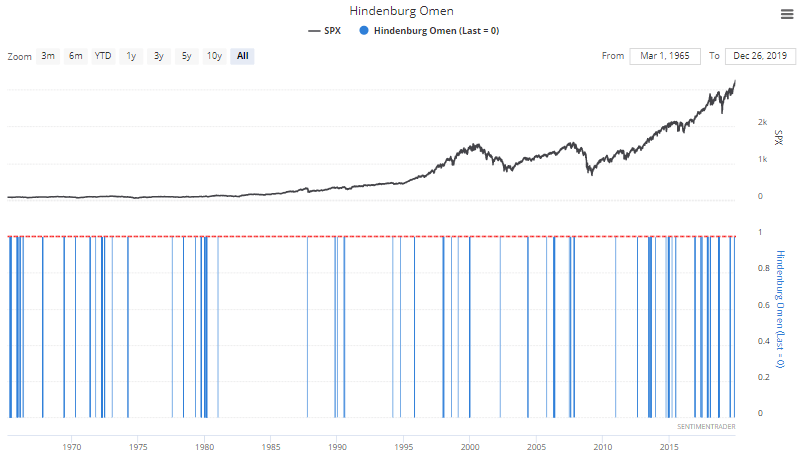
Hindenburg Omen, derived from Germany’s Hindenburg airship crash on May 6, 1937, is a technical indicator that foreshadows an increased probability of a looming stock market crash.
The term was coined by James R. Miekka, and it derives its essence from the tragic crash of the airship that once stood as a pillar of hope for aviation, air travel, and the future of humanity. With 36 people killed in the accident, the Hindenburg crash brought upon a wave of sadness and catastrophe, thus resembling the relative nature of the world when a stock market crashes.
Capital markets are fraught with a selection of technical indicators, categorized into the following four buckets:
The Hindenburg omen – using a combination of the above – is one such bearish indicator that is based on the assumption that stock market declines are preceded by breadth divergences.
A healthy bullish stock market rally is said to abide by the principles of unity – most stocks within a said index are performing well and contributing to the booming stock market. However, breadth divergences occur when the advancing stock market is due to a few big players overshadowing the bearish nature of the rest of the stocks in the index.
The concept is reflected quantitatively through the 52-week highs and lows in an index. When there are many highs and lows in a market, it signals a certain market sentiment, i.e., the market seems to be at a turning point in its rally.
Other characteristics that define the Hindenburg Omen:
Traders react varyingly to the Hindenburg Omen, but two typical actions following an “active signal” are:
Despite its accolades and a fool-proof logic, the Hindenburg Omen is said to come with certain caveats. Claimed by some to offer a 25% accuracy, the validity of the Hindenburg Omen remains debatable. Some unfortunate consequences of the indicator are:
All in all, the Hindenburg Omen is an important technical indicator that’s proven its worth over the years. However, there is always a certain amount of caution that must go into interpreting signals in a stock market, so the Hindenburg Omen is not the only one a trader must rely on.
CFI is the official provider of the Capital Markets & Securities Analyst (CMSA)® certification program, designed to transform anyone into a world-class financial analyst.
In order to help you become a world-class financial analyst and advance your career to your fullest potential, these additional resources will be very helpful:


