Get Certified for Financial Modeling (FMVA)®
Gain in-demand industry knowledge and hands-on practice that will help you stand out from the competition and become a world-class financial analyst.
"There is a consistent relationship between the cumulative production quantity of a company and the cost of production"
Introduced by the Boston Consulting Group, Experience Curve is a concept that states that there is a consistent relationship between the cumulative production quantity of a company and the cost of production. The concept implies that the more experienced a company is in manufacturing a specific product, the lower its cost of production.
When the total production capacity (from the first unit to the last) doubles, the value-added costs decline by a constant percentage. The value-added costs include the cost of manufacturing, marketing, distribution, and administration.
The concept of experience curve was first introduced by Boston Consulting Group (BCG) in the 1960s while analyzing cost behavior in companies. Bruce Henderson, the group’s founder, led a study into a leading manufacturer of semiconductors to analyze the relationship between cost behavior and production quantity. The research found that when the manufacturer doubled the volume of production, there was a 25% decline in the overall cost of manufacturing.
Boston Consulting Group defined the relationship as “experience curve,” where a company gains more experience by producing more of a particular product. Additional research conducted by BCG in the late 1960s and early 1970s revealed that the experience curve effect for various industries ranged between 10% and 25%.
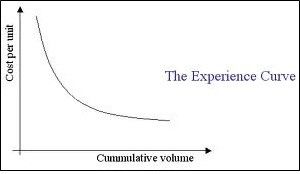
When representing an experience curve on a graph, the cost per unit of production is plotted on the Y-axis, while the cumulative production quantity is plotted on the X-axis. The unit cost of production includes the cost incurred by the company to add value to the product but excludes the cost of purchasing the materials.
The curve shows that as the company increases its overall cumulative production quantity, the unit costs decline at a constant rate. The decline goes on without limit and is surprisingly consistent, even from one industry to another. In some cases, the absence of experience in some industries may be viewed as an outcome of mismanagement.
Based on the research conducted by BSG, we can deduce that the experience curve of lower unit costs tends to become stronger for large businesses that are market leaders in their respective industries.
A company that benefits from the effects of an experience curve enjoys several advantages over its competitors. As the business grows and lowers its unit production costs, it will gain a bigger market share over its rivals. It means that it will control a bigger portion of the market, increasing its profit potential.
Since the company enjoys cost advantages over competitors due to the reduced cost of production, it can develop a penetrative pricing strategy by setting a low price to attract more customers to purchase its products. Other strategies used to increase market share include increasing investment in marketing, production capacity, hiring more sales personnel, etc.
On the downside, the experience curve can sometimes come to an abrupt end when the competitors discover the strategy and replicate the cost reductions without making huge capital investments to gain experience. The experience curve can also come to an end when new technologies are introduced, and the company will need to create a new curve. It must upgrade its processes by replacing the old experience curve with a new one that allows it to retain its competitive advantage.
One of the criticisms of the experience curve is that it makes market leaders complacent with their achievements. By getting the benefits of experience curve effects, the companies become reluctant to continually innovate and lower the unit costs because of their experience.
As a result, such companies become satisfied with their level of achievement. They begin resisting change, which may eliminate their cost benefits of the experience curve. Competitors that replicate the strategies and adopt the latest technologies will easily surpass the market leaders and achieve their own experience curve.
Another criticism of the experience curve is the inability to measure its effects. Most of the time, its effects are closely related to economies of scale, and it will be impossible to differentiate between the two. Economies of scale are the cost benefits gained due to an increased level of production, whereas experience curve effects are the cost benefits achieved through experience by performing repetitive tasks.
Both concepts are intertwined, and it is difficult to differentiate between experience and increased level of production. It makes it difficult to measure the cost benefits of each function.
CFI is the official provider of the Financial Modeling and Valuation Analyst (FMVA)® certification program, designed to transform anyone into a world-class financial analyst.
To keep learning and developing your knowledge of financial analysis, we highly recommend the additional resources below:


