Bank Income Statement Ratio Calculator
Bank Income Statement Ratio Calculator
The Bank Income Statement Ratio Calculator can determine a bank’s profitability, efficiency, and growth through information found on an income statement. Using inputs such as operating expenses, net interest expenses, and net income, the calculator will produce ratios that are important for the analysis of a bank’s income statement.
This template includes the following ratios:
- Efficiency Ratio
- Operating Leverage
- Earnings per Share
- Dividend Yield
Here is a preview of CFI’s Bank Income Statement Ratio Calculator:
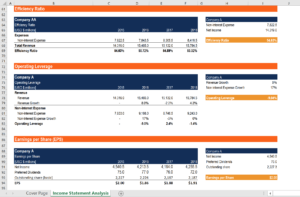
Efficiency Ratio
The efficiency ratio is used to determine the efficiency of a bank by comparing non-interest expense to revenue. The formula for the efficiency ratio is:
Efficiency Ratio = Non-Interest Expense / Revenue
Since the non-interest expense is in the numerator, a higher efficiency ratio suggests a more efficient bank.
Operating Leverage
Operating leverage is another metric to measure the efficiency of a bank. Unlike the operating leverage used for other companies, calculating this ratio for a bank uses different inputs. For a bank, this ratio compares the growth rate of non-interest expense and revenue.
The formula for the operating leverage is:
Operating Leverage = Growth Rate of Revenue – Growth Rate of Non-Interest Expense
Since the metric takes the difference between the growth rate for revenue and expense, a positive ratio means a bank is more efficient in growing operations.
Earnings per Share (EPS)
Earnings per share is a metric that is used in all industries. EPS is used to compare the profitability of different companies in the same industry. It is a suitable ratio as allocating earning to the number of shares, the size difference between companies is removed.
The formula for EPS is:
Earnings per Share = (Net Income – Preferred Dividends) / Outstanding Share
A higher EPS demonstrates a company that is more profitable on a shareholder basis.
Dividend Yield
Dividend yield measures the amount of dividend per share in relation to the share price. This gives investors an easy way of comparing different companies by looking at the return on each dollar spent on a share.
The formula for dividend yield is:
Dividend Yield = Dividend per Share / Share Price
A higher dividend yield demonstrates a higher dividend gained on each dollar spent on purchasing a share.
Additional Resources
For more resources, check out CFI’s business templates library to download numerous free Excel modeling, PowerPoint presentation, and Word document templates. See also our financial modeling resources and Excel resources.
Analyst Certification FMVA® Program
Below is a break down of subject weightings in the FMVA® financial analyst program. As you can see there is a heavy focus on financial modeling, finance, Excel, business valuation, budgeting/forecasting, PowerPoint presentations, accounting and business strategy.

A well rounded financial analyst possesses all of the above skills!
Additional Questions & Answers
CFI is the global institution behind the financial modeling and valuation analyst FMVA® Designation. CFI is on a mission to enable anyone to be a great financial analyst and have a great career path. In order to help you advance your career, CFI has compiled many resources to assist you along the path.
In order to become a great financial analyst, here are some more questions and answers for you to discover:
- What is Financial Modeling?
- How Do You Build a DCF Model?
- What is Sensitivity Analysis?
- How Do You Value a Business?
Excel Tutorial
To master the art of Excel, check out CFI’s Excel Crash Course, which teaches you how to become an Excel power user. Learn the most important formulas, functions, and shortcuts to become confident in your financial analysis.

Launch CFI’s Excel Crash Course now to take your career to the next level and move up the ladder!


