P/E Ratio Template
P/E Ratio Template
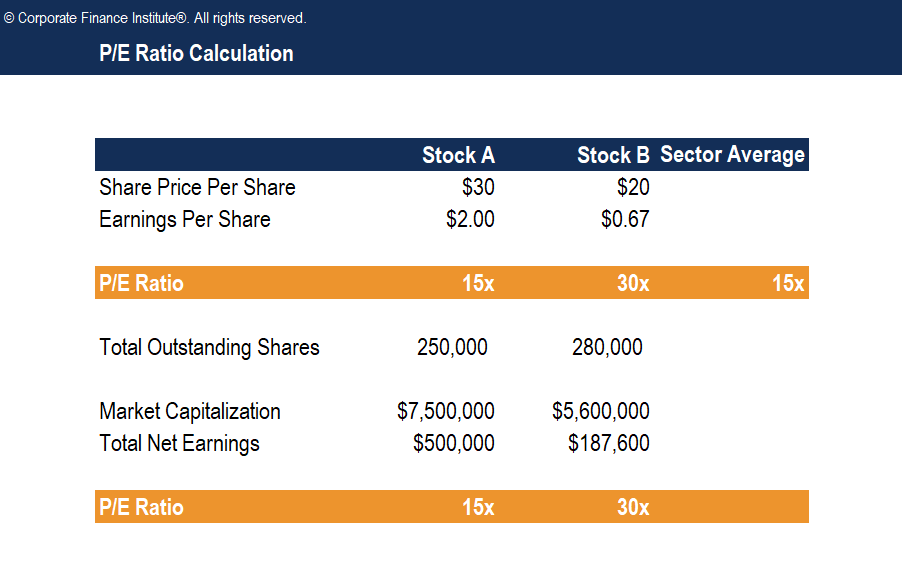
This P/E ratio template will show you how to calculate the Price-to-Earnings multiple using share price and earnings per share.
Here is a screenshot of the template:
Download the Free Template
Enter your name and email in the form below and download the free template now!
What is the Price Earnings Ratio?
The Price Earnings Ratio (P/E ratio) is the relationship between a company’s stock price and earnings per share (EPS). It is a popular ratio that gives investors a better sense of the value of the company. The P/E ratio shows the expectations of the market and is the price you must pay per unit of current earnings (or future earnings, as the case may be).
Earnings are important when valuing a company’s stock because investors want to know how profitable a company is and how profitable it will be in the future. Furthermore, if the company doesn’t grow and the current level of earnings remains constant, the P/E can be interpreted as the number of years it will take for the company to pay back the amount paid for each share.
More Free Templates
For more resources, check out our business templates library to download numerous free Excel modeling, PowerPoint presentation and Word document templates.
Additional Resources
CFI is a global provider of financial modeling courses and of the FMVA Certification. CFI’s mission is to help all professionals improve their technical skills. If you are a student or looking for a career change, the CFI website has many free resources to help you jumpstart your Career in Finance. If you are seeking to improve your technical skills, check out some of our most popular courses. Below are some additional resources for you to further explore:
The Financial Modeling Certification

Analyst Certification FMVA® Program
CFI is a global provider of financial modeling courses and of the FMVA Certification. CFI’s mission is to help all professionals improve their technical skills. If you are a student or looking for a career change, the CFI website has many free resources to help you jumpstart your Career in Finance. If you are seeking to improve your technical skills, check out some of our most popular courses. Below are some additional resources for you to further explore:
The Financial Modeling Certification
Below is a break down of subject weightings in the FMVA® financial analyst program. As you can see there is a heavy focus on financial modeling, finance, Excel, business valuation, budgeting/forecasting, PowerPoint presentations, accounting and business strategy.

A well rounded financial analyst possesses all of the above skills!
Additional Questions & Answers
CFI is the global institution behind the financial modeling and valuation analyst FMVA® Designation. CFI is on a mission to enable anyone to be a great financial analyst and have a great career path. In order to help you advance your career, CFI has compiled many resources to assist you along the path.
In order to become a great financial analyst, here are some more questions and answers for you to discover:
- What is Financial Modeling?
- How Do You Build a DCF Model?
- What is Sensitivity Analysis?
- How Do You Value a Business?
Excel Tutorial
CFI is a global provider of financial modeling courses and of the FMVA Certification. CFI’s mission is to help all professionals improve their technical skills. If you are a student or looking for a career change, the CFI website has many free resources to help you jumpstart your Career in Finance. If you are seeking to improve your technical skills, check out some of our most popular courses. Below are some additional resources for you to further explore:
The Financial Modeling Certification

Launch CFI’s Excel Crash Course now to take your career to the next level and move up the ladder!


