Get Certified for Financial Modeling (FMVA)®
Gain in-demand industry knowledge and hands-on practice that will help you stand out from the competition and become a world-class financial analyst.
A Price/Sales ratio for a whole country
The Market Cap to GDP Ratio (also known as the Buffett Indicator) is a measure of the total value of all publicly-traded stocks in a country, divided by that country’s Gross Domestic Product (GDP). It used as a broad way of assessing whether the country’s stock market is overvalued or undervalued, compared to a historical average. It is a form of Price/Sales valuation multiple for an entire country.
The formula is:

The stock market cap to GDP ratio has become known as the Buffett Indicator in recent years, as Warren Buffett commented to Fortune Magazine that he believes it is “probably the best single measure of where valuations stand at any given moment.”
The reason he says this is that it’s a simple way of looking at the value of all stocks on an aggregate level, and comparing that value to the country’s total output, which is its gross domestic product. This relates very closely to a price-to-sales ratio, which is a very high-level form of valuation.
In the graph below (photo credit: Advisor Perspectives) you can see the ratio over time.
The numerator is equal to The Wilshire 5000 Total Market Index, which is a market-cap index representing the value of all stocks traded in the United States.
The denominator is the quarterly United States GDP.
As you can see, the average is about 75% with a few spikes over 100% and some periods below 50%.
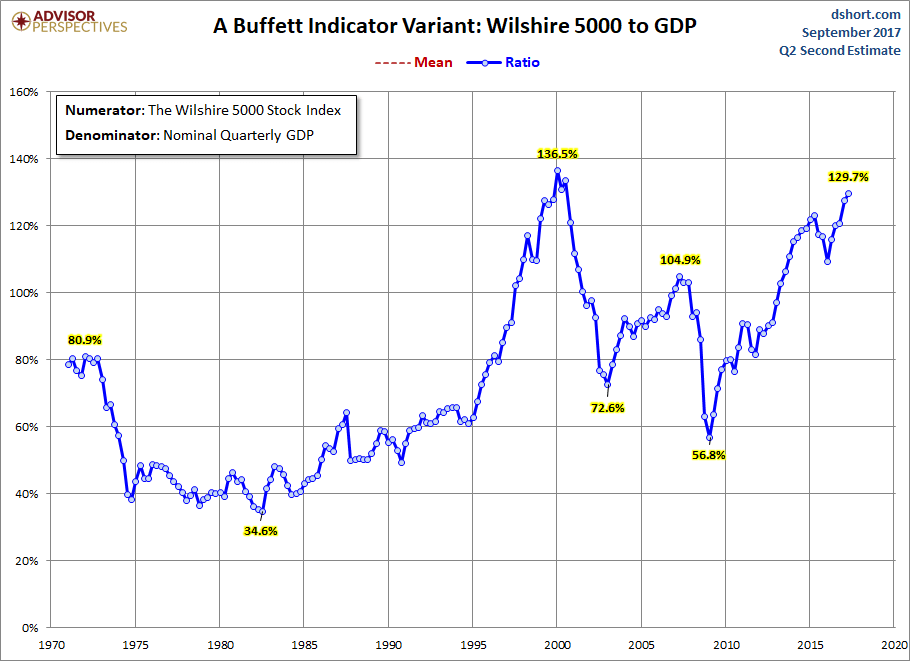
Photo credit: AdvisorPerspectives (advisorperspectives.com)
The indicator is like a price-to-sales ratio for the entire country. In valuation, and more specifically comparable company analysis, the Price/Sales or EV/Sales metric is used as a measure of valuation.
A Price/Sales ratio of greater than 1.0x (or 100%) is generally considered a sign of being highly valued, while companies trading below 0.5x (or 50%) are considered to be cheap. In order to properly assess a company’s valuation, other factors have to be taken into consideration, such as margins and growth.
This is consistent with the interpretation of the Buffett Indicator, which makes sense since it’s essentially the same ratio, but for an entire country instead of for just one company.
While the Buffett Indicator is a great high-level metric, a price/sale ratio is also fairly crude. It doesn’t take into account the profitability of businesses, only their top-line revenue figure, which can be misleading.
Additionally, the ratio has been trending higher over a long period of time (about the last 30 years) and therefore, many investors question what a reasonable average ratio should be. While the average is 75%, and many believe being over 100% indicates the market is overvalued, others believe the “new normal” is closer to 100%.
Finally, this ratio is impacted by trends in Initial Public Offerings (IPOs), and the percentage of companies that are publicly traded (compared to those that are private). All else being equal, if there was a large increase in the percentage of companies that are public vs. private, the Market Cap to GDP ratio would go up, even though nothing has changed from a valuation perspective.
Thank you for reading CFI’s guide to Market Cap to GDP Ratio (the Buffett Indicator). Please check out these free resources to help advance your career:


