Get Certified for Financial Modeling (FMVA)®
Gain in-demand industry knowledge and hands-on practice that will help you stand out from the competition and become a world-class financial analyst.
Bank valuation stands apart from traditional business valuation methods. While financial analysts typically rely on metrics like enterprise value (EV) and discounted cash flow (DCF) to value businesses in other industries, these approaches fall short when applied to banks. The banking sector’s unique operations demand a different analytical toolkit.
If you’re familiar with valuing non-financial companies, you’ll discover that bank valuation requires a distinct mindset and methodology. Understanding the key differences, specialized metrics, and valuation techniques reveals how to effectively capture a bank’s true value.
Banks operate in a unique environment where financing and operations are deeply intertwined, unlike manufacturing or tech companies, where these functions remain distinct.
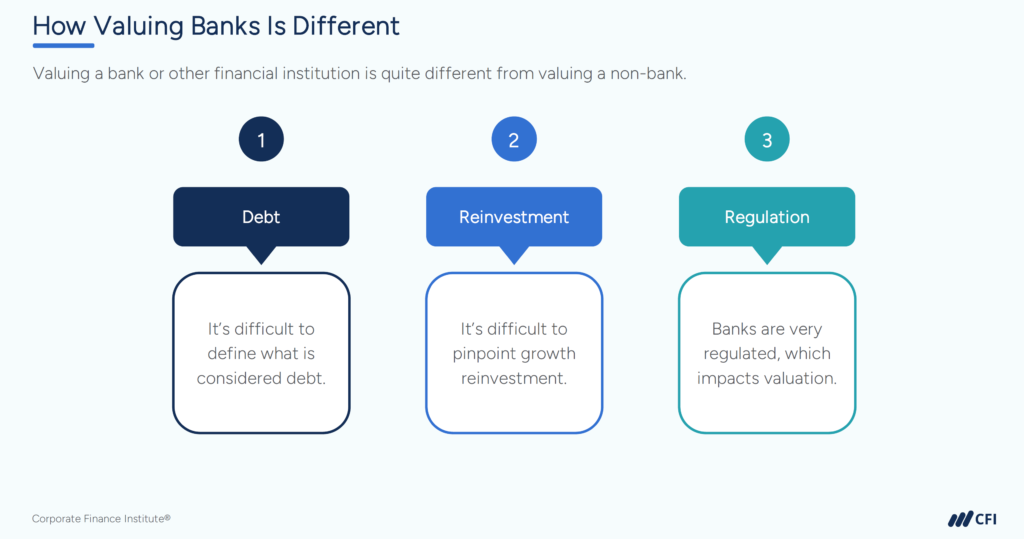
The standard valuation playbook that works so well for other industries needs significant adaptation for banks, primarily due to their distinctive business model and regulatory framework. Three fundamental differences that make bank valuation a specialized field.
One of the key challenges in valuing a bank is determining what qualifies as debt and how reinvestment is measured. For non-banks, debt is any interest-bearing liability that remains separate from day-to-day operations. Companies can decide how much debt to take on, and interest expense appears below operating income on the income statement.
But in banking, debt (customer deposits) functions as both a liability and a key “raw material” for generating revenue. Deposits allow banks to issue loans and earn interest income. This interconnection of financing and operations makes traditional debt classification more complex for banks than for non-banks.
Non-banks typically reinvest profits in tangible assets, like property, plant, and equipment (PP&E), or by increasing working capital to support growth.
Banks, however, don’t require significant PP&E investment. Instead, reinvestment happens through:
Because banks must retain earnings to meet regulatory capital requirements, making free cash flow difficult to measure.
Regulatory oversight also plays a significant role in bank valuation.
Banks must comply with regulations like Common Equity Tier 1 (CET1) that impose capital buffers. This regulatory capital acts as a constraint on free cash flows, limiting how much banks can distribute to shareholders as dividends. It also makes it difficult to apply a discounted cash flow (DCF) valuation approach.
Understanding how bank valuation works requires analyzing the unique structure of bank financial statements. Unlike regular companies, where income statements often dominate the valuation process, banks rely heavily on their balance sheets and regulatory metrics.
Let’s dive deeper into financial statement differences.
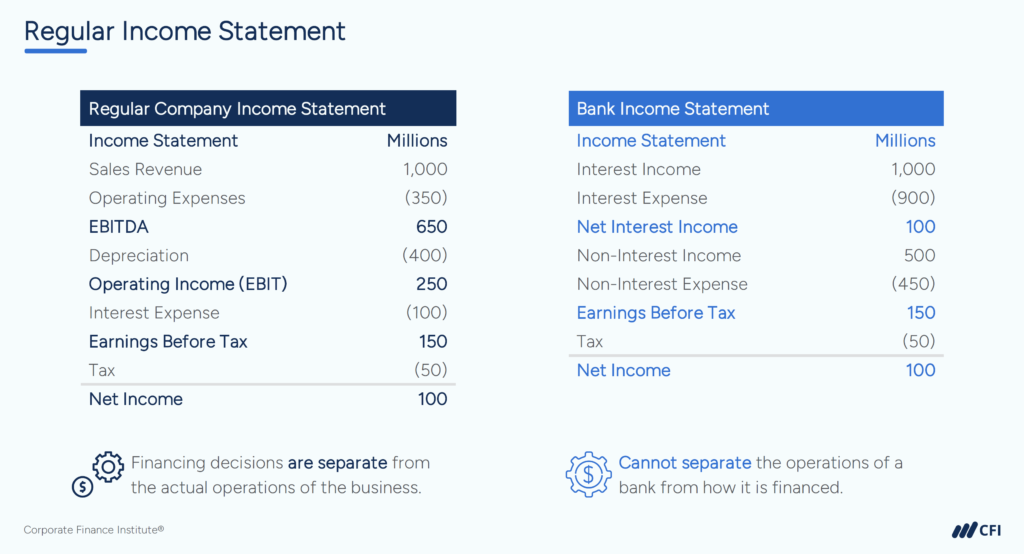
Banks and non-banks structure their income statements very differently. Here’s how:
Non-Banks:
Banks:
The inclusion of financing in operations fundamentally changes how profitability and operational efficiency are measured for banks.
Non-Banks:
Assets include inventory and PP&E, while liabilities often include accounts payable and long-term debt.
Banks:
Another key difference lies in how reinvestment is defined:
Non-Banks:
Banks:
These differences in financial statements highlight why banks require a unique valuation approach. Their reliance on balance sheets, integrated financing, and regulatory constraints fundamentally distinguishes them from regular companies. It also means a shift from traditional valuation metrics like enterprise value.
| Income Statements | – Earn revenue from sales of products or services. – Classify interest expense as a non-operating item, appearing below operating income. | – Earn interest income on loans instead of sales revenue. – Classify interest expense on deposits as an operating expense, making financing a core part of operations. – The inclusion of financing in operations fundamentally changes how profitability and efficiency are measured for banks. |
| Balance Sheets | – Focused less on balance sheets, with greater emphasis on income statements. – Assets include inventory and PP&E. – Liabilities often include accounts payable and long-term debt. | – Bank valuation relies heavily on balance sheets. – Loans = Assets: Loans generate future cash flows and are recorded as assets. – Deposits = Liabilities: Deposits are owed to customers but also serve as the raw material for generating loans. – Debt Classification: Unlike non-banks, where debt is clearly defined, customer deposits blur the line between financing and operations, complicating classification. |
| Reinvestment and Cash Flows | – Reinvestment typically involves expanding physical assets, such as PP&E, or increasing working capital. | – Reinvestment is primarily focused on regulatory capital and retained earnings. – To meet regulatory requirements (such as CET1 ratios), banks face constraints on free cash flows, making valuation with traditional DCF models challenging. |
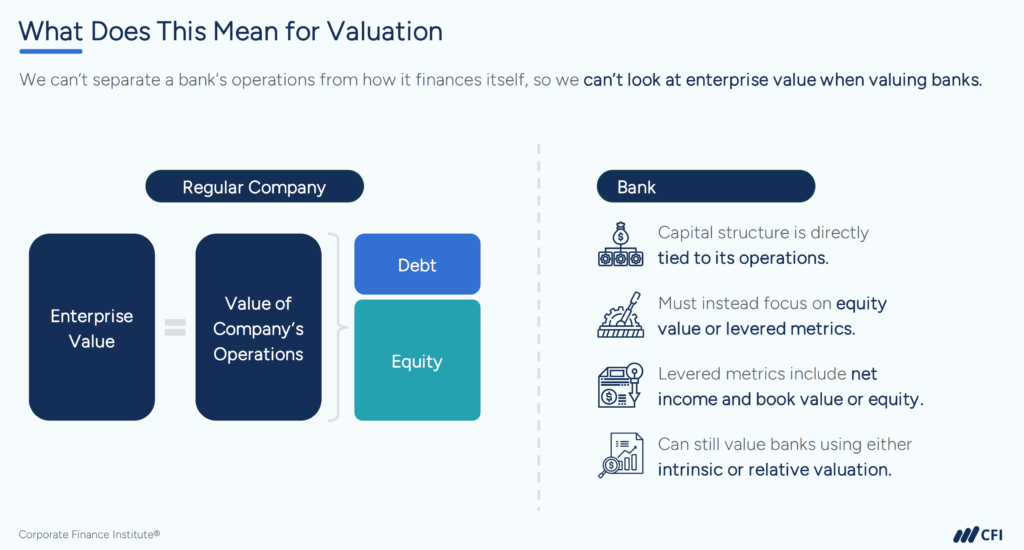
You’re probably familiar with enterprise value (EV) as a go-to metric for company valuation. But when it comes to banks, EV just doesn’t cut it. Let’s explore the financial metrics that actually tell us what we need to know about a bank’s value.
Since financing is inseparable from operations, equity value (or net asset value) becomes the primary focus in bank valuation. This approach allows for an accurate representation of a bank’s operational performance and shareholder value.
In contrast to traditional unlevered measures like EBITDA, banks use levered metrics, such as:
Banks operate under stringent regulatory requirements that impact their valuation. These include:
Analysts can also incorporate certain traditional ratios in their valuation:
Valuing banks requires a shift in perspective, focusing on equity value and specialized metrics like CET1, P/E, and P/TB. These considerations account for the interconnected nature of operations and financing, offering a more accurate representation of a bank’s value.
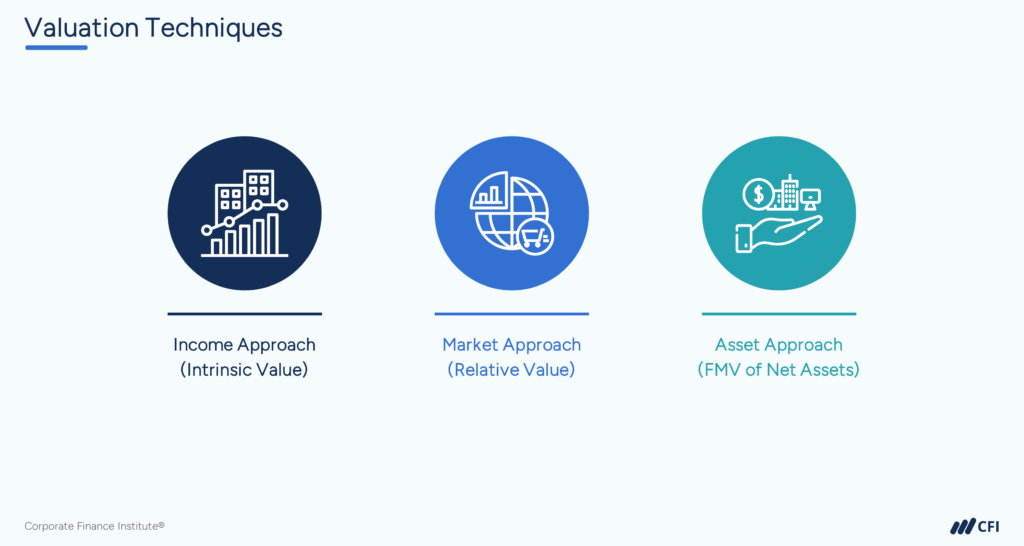
Bank valuation involves three specialized techniques that reflect their unique financial structure and regulatory environment: the Dividend Discount Model, Residual Income Model, and Relative Valuation (Comps).
The DDM values banks based on the present value of future dividends, discounted using the cost of equity.
This method is widely used because banks often have stable dividend payout policies, but it depends heavily on assumptions about regulatory capital constraints.
The residual income model focuses on the value a bank generates above its cost of equity.
Relative valuation compares a bank to its peers using valuation multiples, such as:
When to Use Comps:
This method is especially useful when comparable public banks are available, as it reflects market sentiment and relative performance. P/TB is particularly preferred for banks, given the relevance of tangible equity.
Each of these methods — DDM, RI, and comps — offers unique insights into a bank’s valuation. While DDM focuses on cash flow distribution, RI emphasizes excess returns, and comps provide a market-based perspective. Together, they form a comprehensive toolkit for valuing banks.
Bank valuation requires a different approach because operations, financing, and regulatory capital are deeply connected. Enterprise value is not applicable, so valuation methods focus on equity-based metrics and specialized ratios like P/TB and CET1.
Mastering these techniques is a requirement for financial analysts and valuation specialist roles in investment banking, capital markets research, or in a bank’s corporate finance department. Understanding how bank valuation works gives you a strong foundation to analyze financial institutions effectively.
Ready to put these valuation techniques into practice? Enroll in CFI’s Introduction to Bank Valuation course. Learn real-world applications of DDM, residual income, and comps valuation — all with expert guidance that gives you a powerful edge.
Enroll in Introduction to Bank Valuation!


