Get Certified for Financial Modeling (FMVA)®
Gain in-demand industry knowledge and hands-on practice that will help you stand out from the competition and become a world-class financial analyst.
P/E adjusted for Growth
The PEG ratio is a company’s Price/Earnings ratio divided by its earnings growth rate over a period of time (typically the next 1-3 years). The PEG ratio adjusts the traditional P/E ratio by taking into account the growth rate in earnings per share that are expected in the future. This can help “adjust” companies that have a high growth rate and a high price to earnings ratio.
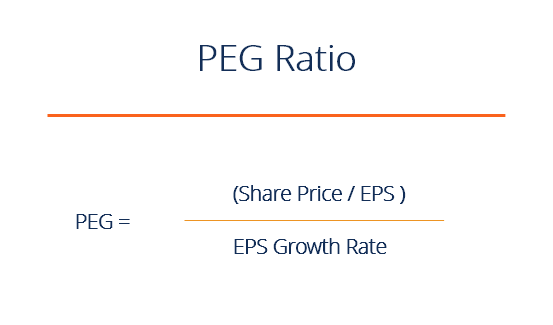
The PEG ratio formula for a company is as follows:
PEG = Share Price / Earnings per Share / Earnings per Share Growth Rate
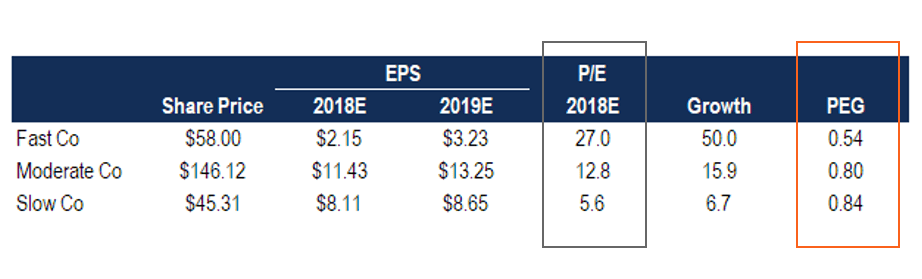
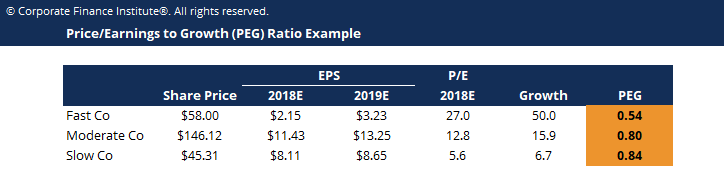
Using the example shown in the table at the top of this guide, there are three companies we can compare – Fast Co, Moderate Co, and Slow Co.
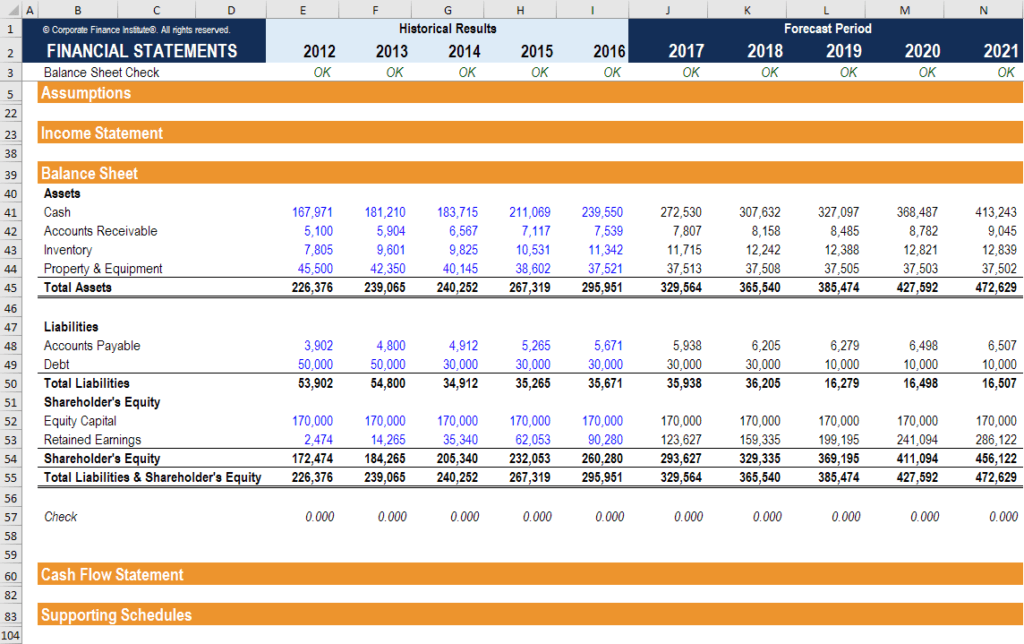
Download CFI’s Excel template to advance your finance knowledge and perform better financial analysis.
Based on the above examples, Fast Co has the highest P/E ratio at 27-times, and on the surface, it may look expensive. Slow Co, on the other hand, has a very low PE ratio of only 5.6-times, which may cause investors to think it’s cheap.
There is one major difference between these two companies (all else being equal), which is that Fast Co is growing its earnings per share at a much faster rate than Slow Co. Given how quickly Fast Co is growing, it seems reasonable to pay more for the stock. One way of estimating how much more is by dividing each company’s P/E ratio by its growth rate. When we do this, we see that Fast Co may actually be “cheaper” than Slow Co given its increasing EPS.
While the ratio helps adjust for growth over a period of time, it typically only takes into account a short time period, such as 1-3 years. For this reason, one or two years of high growth may overstate the benefit of buying the faster-growing company. The opposite is true with Slow Co.
Additionally, the ultimate driver of the value of a company – Free Cash Flow– and growth in EPS may not result in growth in cash flow (i.e., high capital expenditures required to achieve the earnings growth).
While it is often a helpful adjustment to P/E, it should be considered only one of various factors when valuing a company.
Using the PEG ratio formula can be useful, but ultimately, financial modeling is the best way to account for all aspects of a company’s growth profile when performing a valuation. Building a Discounted Cash Flow (DCF) model typically takes into account about 5 years of forecasted growth, plus a terminal value, to arrive at the net present value of the business.
There are various types of financial models. To learn more about financial modeling and valuation check out our online financial modeling courses.
Connect what you just learned to a clear career path with CFI’s role‑based courses and certification programs.
Thank you for reading CFI’s guide to PEG Ratio. To continue learning and advancing your career, we highly recommend these additional resources:


