Over 2 million + professionals use CFI to learn accounting, financial analysis, modeling and more. Unlock the essentials of corporate finance with our free resources and get an exclusive sneak peek at the first module of each course.
Start Free
What is the Accounts Payable Turnover Ratio?
The accounts payable turnover ratio, also known as the payables turnover or the creditor’s turnover ratio, is a liquidity ratio that measures the average number of times a company pays its creditors over an accounting period. The ratio is a measure of short-term liquidity, with a higher payable turnover ratio being more favorable.
Accounts Payable Turnover Ratio Formula
The formula for the accounts payable turnover ratio is as follows:
In some cases, cost of goods sold (COGS) is used in the numerator in place of net credit purchases. Average accounts payable is the sum of accounts payable at the beginning and end of an accounting period, divided by 2.
Example of Accounts Payable Turnover Ratio
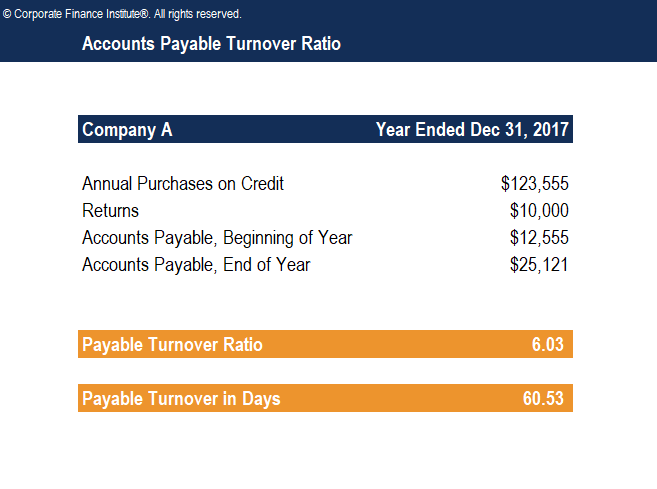
Company A reported annual purchases on credit of $123,555 and returns of $10,000 during the year ended December 31, 2017. Accounts payable at the beginning and end of the year were $12,555 and $25,121, respectively. The company wants to measure how many times it paid its creditors over the fiscal year.
Therefore, over the fiscal year, the company’s accounts payable turned over approximately 6.03 times during the year. The turnover ratio would likely be rounded off and simply stated as six.
Accounts Payable Turnover in Days
The accounts payable turnover in days shows the average number of days that a payable remains unpaid. To calculate the accounts payable turnover in days, simply divide 365 days by the payable turnover ratio.
Payable Turnover in Days = 365 / Payable Turnover Ratio
Determining the accounts payable turnover in days for Company A in the example above:
Payable Turnover in Days = 365 / 6.03 = 60.53
Therefore, over the fiscal year, the company takes approximately 60.53 days to pay its suppliers.
Download CFI’s Free Accounts Payable Turnover Ratio Template
Complete the form below to download our free Accounts Payable Turnover Ratio template!
Interpretation of Accounts Payable Turnover Ratio
The accounts payable turnover ratio indicates to creditors the short-term liquidity and, to that extent, the creditworthiness of the company. A high ratio indicates prompt payment is being made to suppliers for purchases on credit. A high number may be due to suppliers demanding quick payments, or it may indicate that the company is seeking to take advantage of early payment discounts or actively working to improve its credit rating.
A low ratio indicates slow payment to suppliers for purchases on credit. This may be due to favorable credit terms, or it may signal cash flow problems and hence, a worsening financial condition. While a decreasing ratio could indicate a company in financial distress, that may not necessarily be the case. It might be that the company has successfully managed to negotiate better payment terms which allow it to make payments less frequently, without any penalty.
The accounts payable turnover ratio of a company is often driven by the credit terms of its suppliers. For example, companies that obtain favorable credit terms usually report a relatively lower ratio. Large companies with bargaining power who are able to secure better credit terms would result in lower accounts payable turnover ratio (source).
Although a high accounts payable turnover ratio is generally desirable to creditors as signaling creditworthiness, companies should also be taking advantage of the credit terms extended by suppliers, as doing so will result in discounts on purchases.
As with most financial metrics, a company’s turnover ratio is best examined relative to similar companies in its industry. For example, a company’s payables turnover ratio of two will be more concerning if virtually all of its competitors have a ratio of at least four.
Use in Financial Modeling
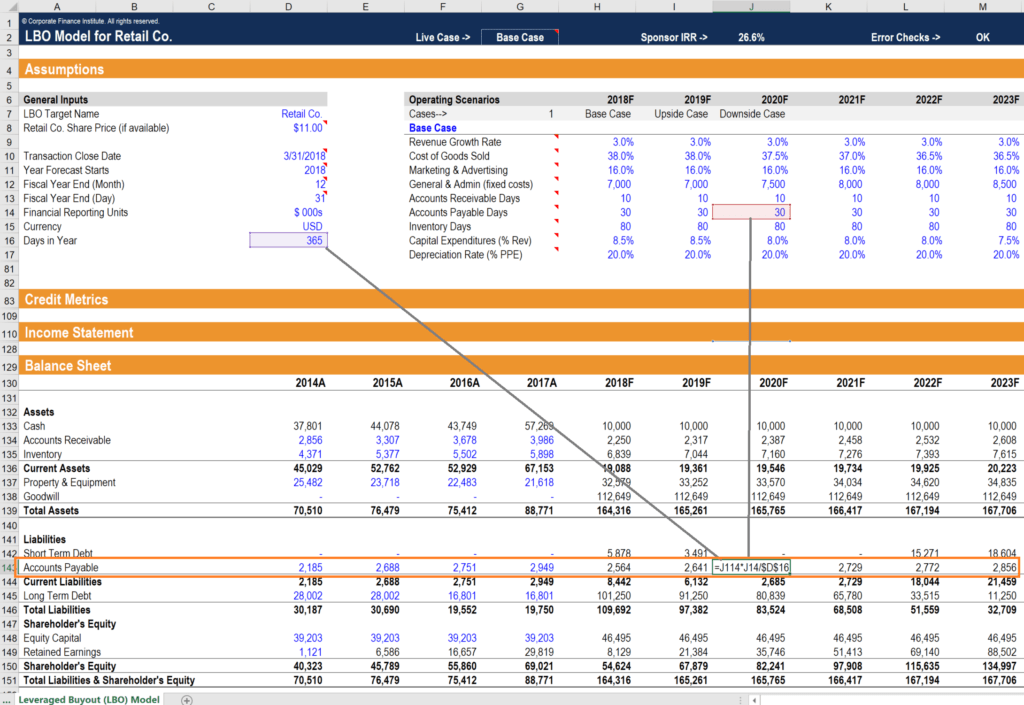
In financial modeling, the accounts payable turnover ratio (or turnover days) is an important assumption for creating the balance sheet forecast. As you can see in the example below, the accounts payable balance is driven by the assumption that cost of goods sold (COGS) takes approximately 30 days to be paid (on average). Therefore, COGS in each period is multiplied by 30 and divided by the number of days in the period to get the AP balance.
The accounts payable turnover ratio is a liquidity ratio that measures how many times a company is able to pay its creditors over a period of time.
A high ratio may be due to suppliers demanding fast payments or the company taking advantage of early payment discounts.
A low ratio may be due to favorable credit terms or a worsening financial condition.
Bargaining power plays a big role in the ratio. Companies with strong bargaining power are given longer credit terms and hence, will report a lower accounts payable turnover ratio.
Dividing 365 by the ratio results in the accounts payable turnover in days, which measures the number of days that it takes a company, on average, to pay creditors.
A higher ratio signals creditworthiness and is sought after by creditors.
Related Reading
Thank you for reading CFI’s guide to Accounts Payable Turnover Ratio. To learn more and advance your career, the following CFI resources will be helpful:
CFI is a global provider of financial modeling courses and of the FMVA Certification. CFI’s mission is to help all professionals improve their technical skills. If you are a student or looking for a career change, the CFI website has many free resources to help you jumpstart your Career in Finance. If you are seeking to improve your technical skills, check out some of our most popular courses. Below are some additional resources for you to further explore:
Below is a break down of subject weightings in the FMVA® financial analyst program. As you can see there is a heavy focus on financial modeling, finance, Excel, business valuation, budgeting/forecasting, PowerPoint presentations, accounting and business strategy.
A well rounded financial analyst possesses all of the above skills!
Additional Questions & Answers
CFI is the global institution behind the financial modeling and valuation analyst FMVA® Designation. CFI is on a mission to enable anyone to be a great financial analyst and have a great career path. In order to help you advance your career, CFI has compiled many resources to assist you along the path.
In order to become a great financial analyst, here are some more questions and answers for you to discover:
Take your learning and productivity to the next level with our Premium Templates.
Upgrading to a paid membership gives you access to our extensive collection of plug-and-play Templates designed to power your performance—as well as CFI's full course catalog and accredited Certification Programs.
Gain unlimited access to more than 250 productivity Templates, CFI's full course catalog and accredited Certification Programs, hundreds of resources, expert reviews and support, the chance to work with real-world finance and research tools, and more.